
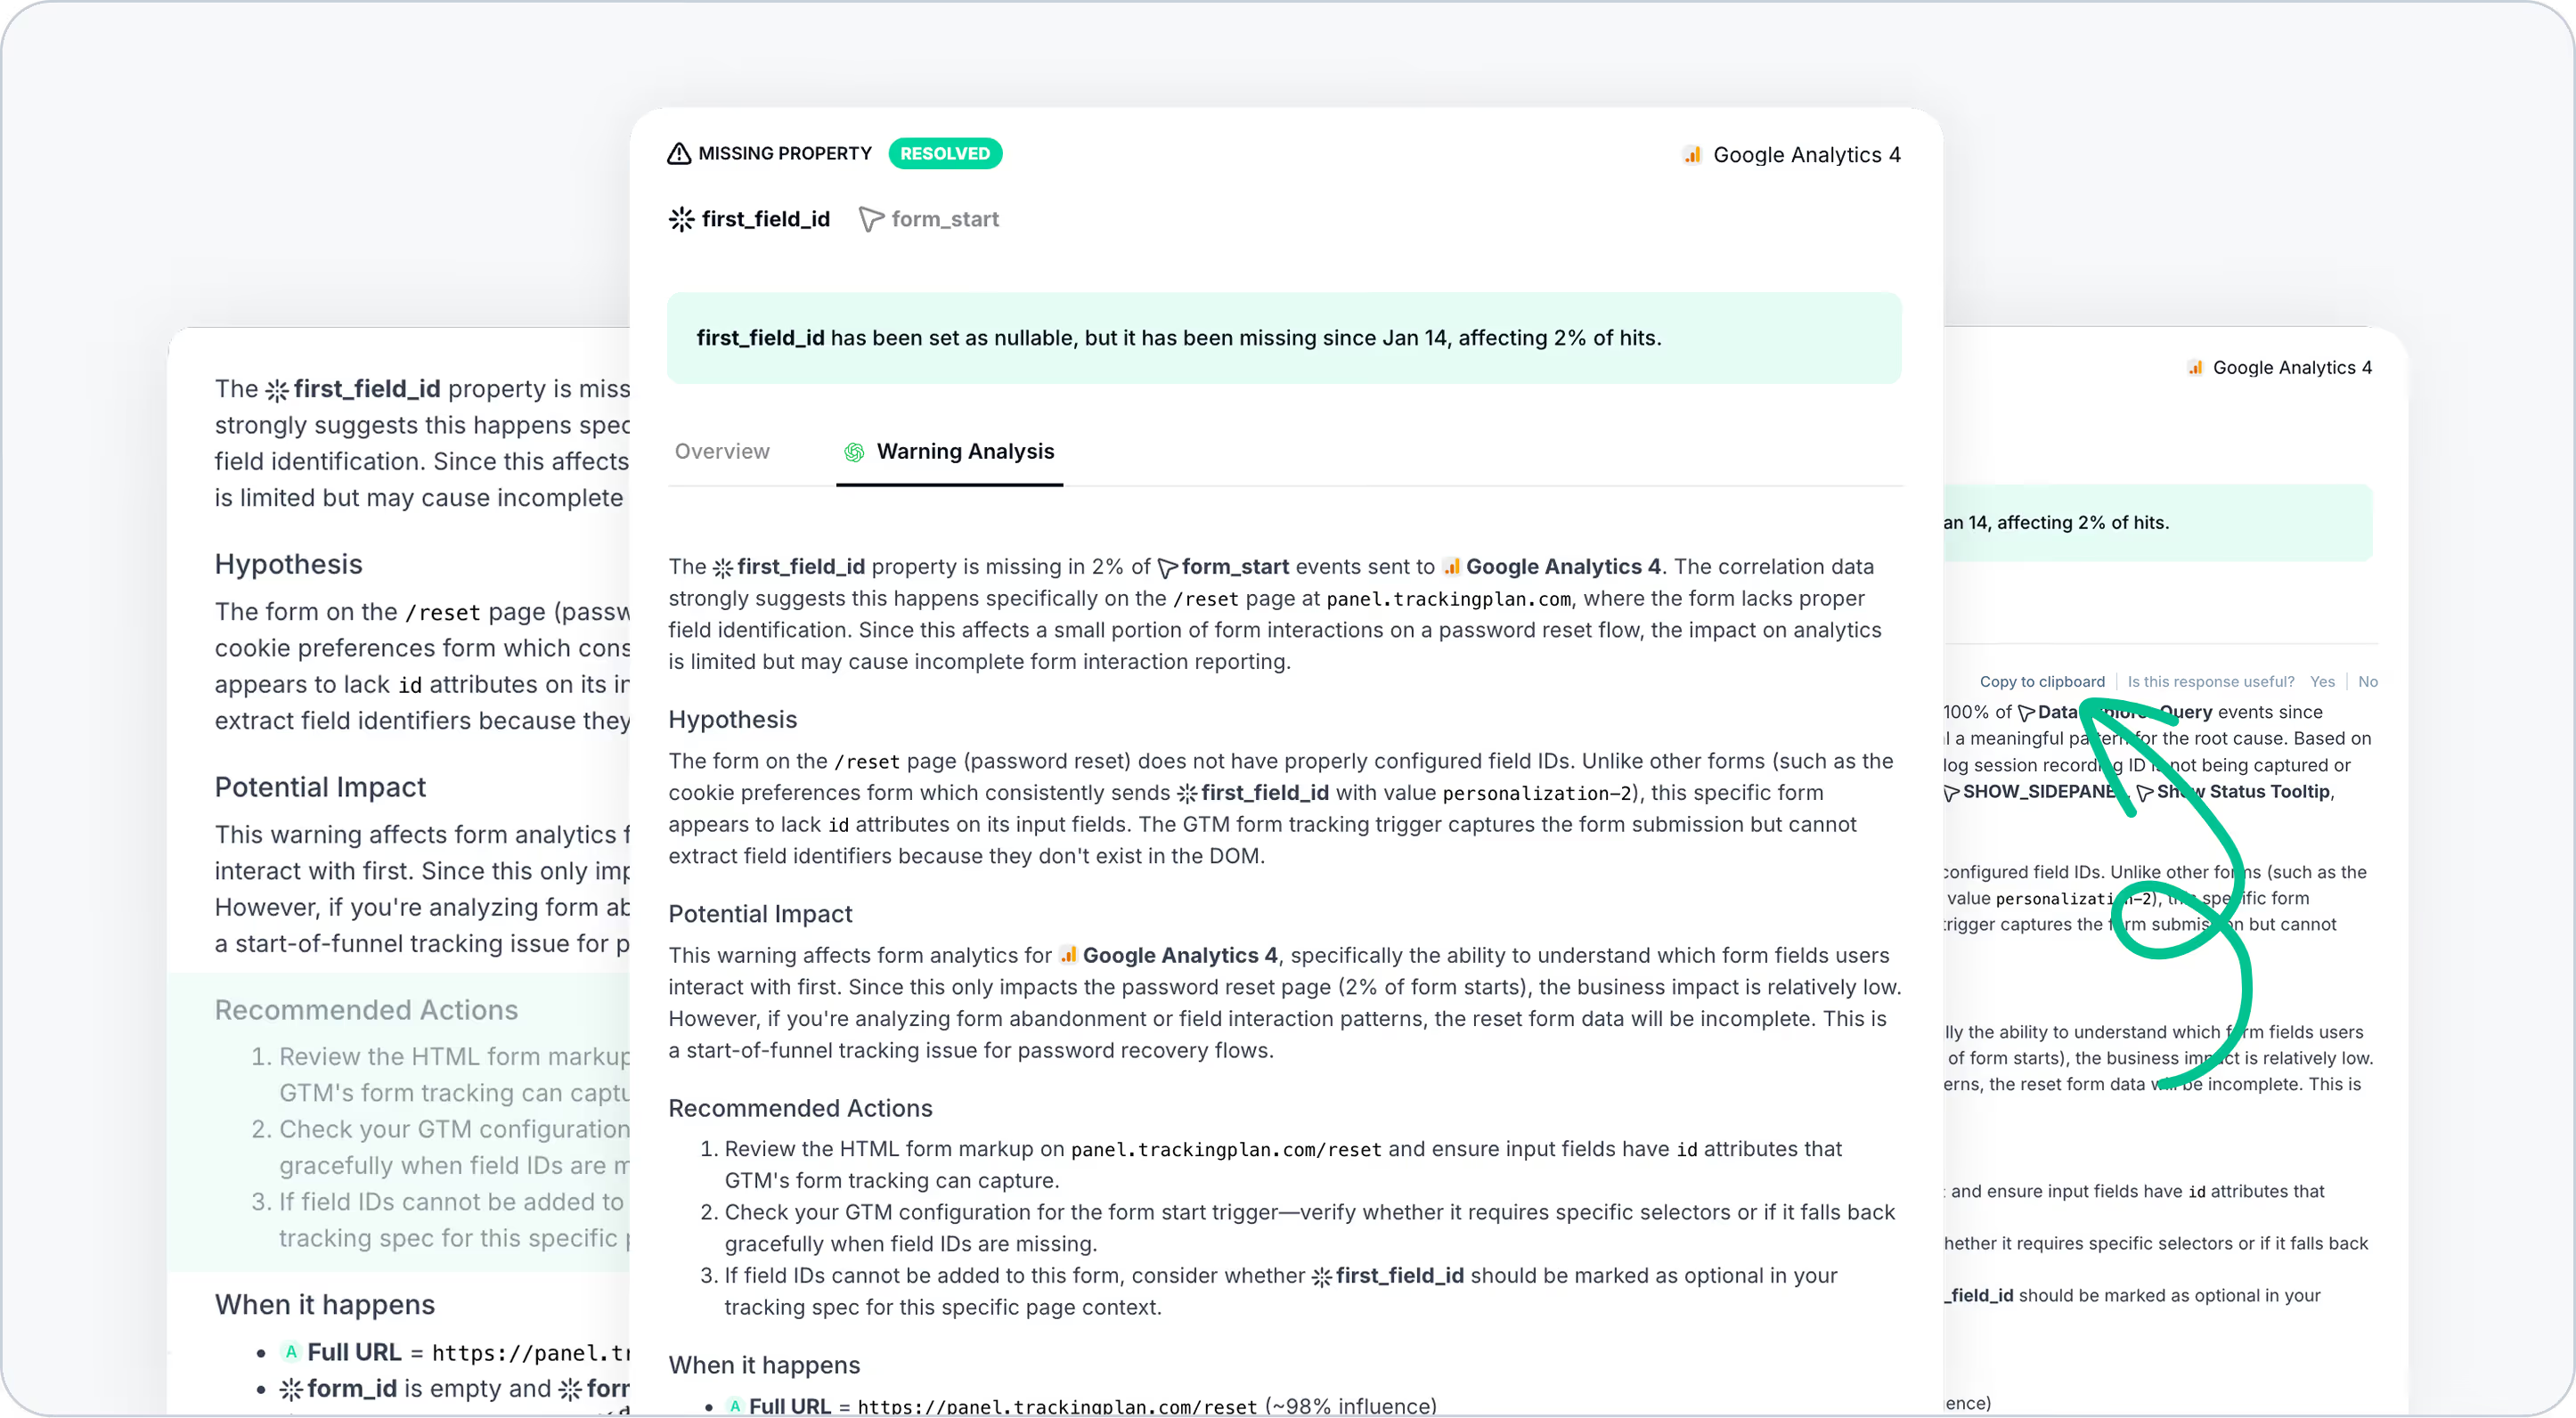
Meet the AI-assisted debugging companion that tells you exactly what to fix, guiding you through the resolution process with clear, step-by-step instructions to act on your tracking warnings
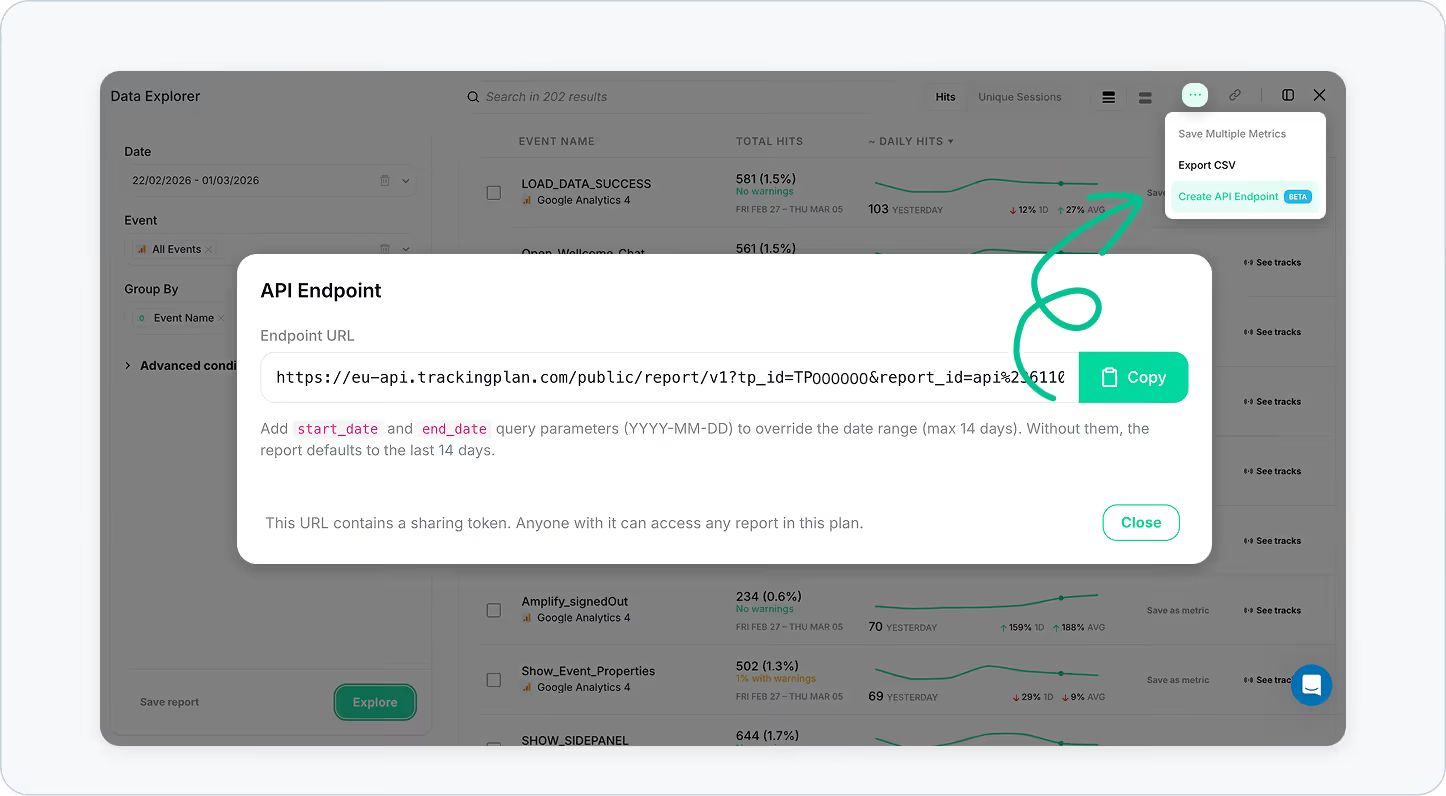
Trackingplan has introduced a new API endpoint that gives you real-time access to your monitoring data directly from Trackingplan’s data exploration views.
More coverage across your full marketing stack! Trackingplan now supports Piano Analytics, Taboola, Outbrain, MNTN, Braze, Monetate & Amazon Ads pixel.
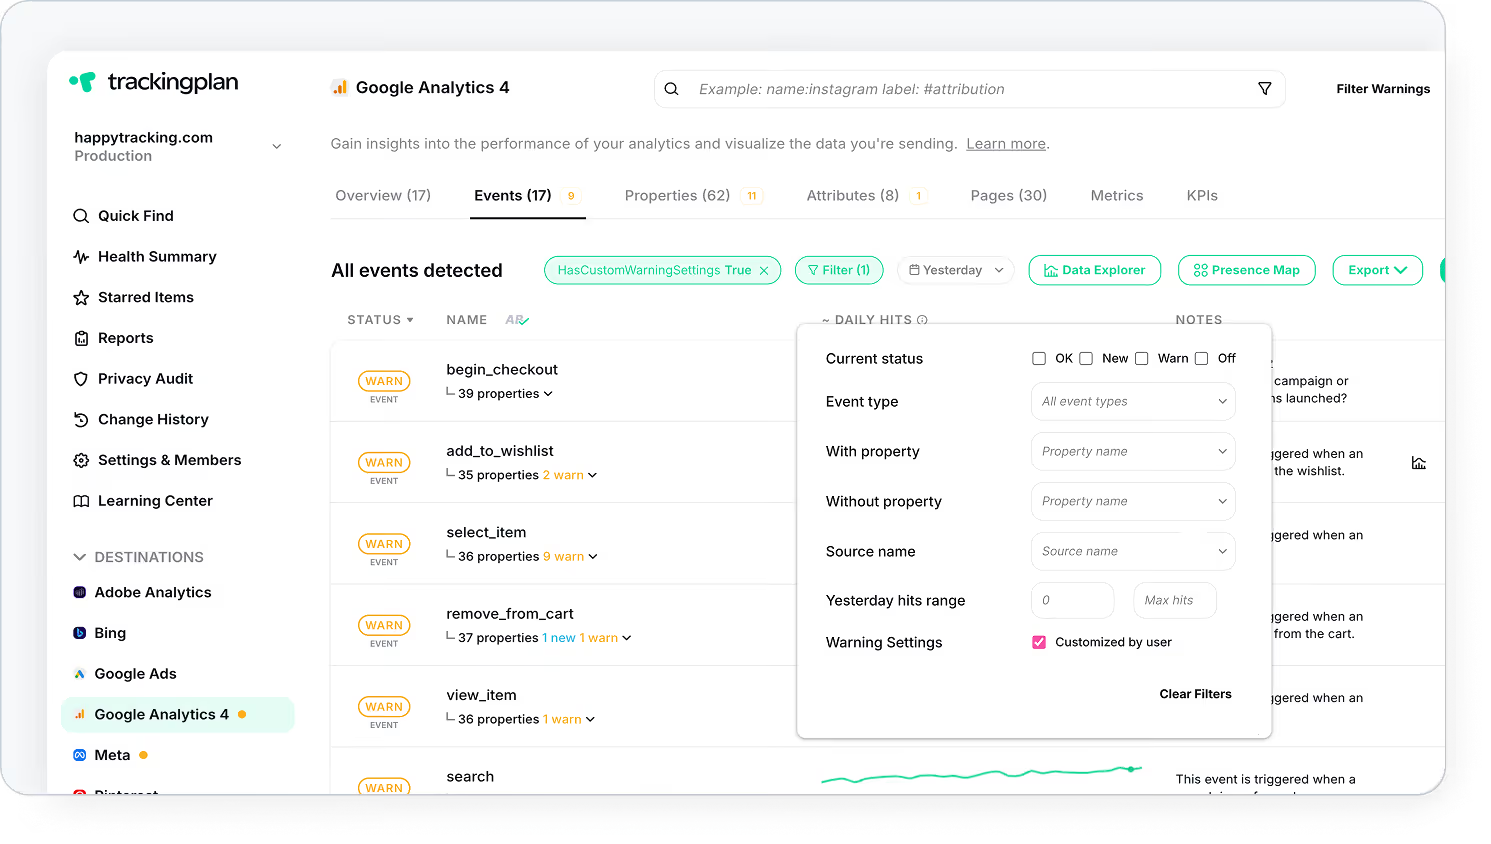
Checking which events have real-time warnings used to mean digging through each event’s settings—now it’s effortless.
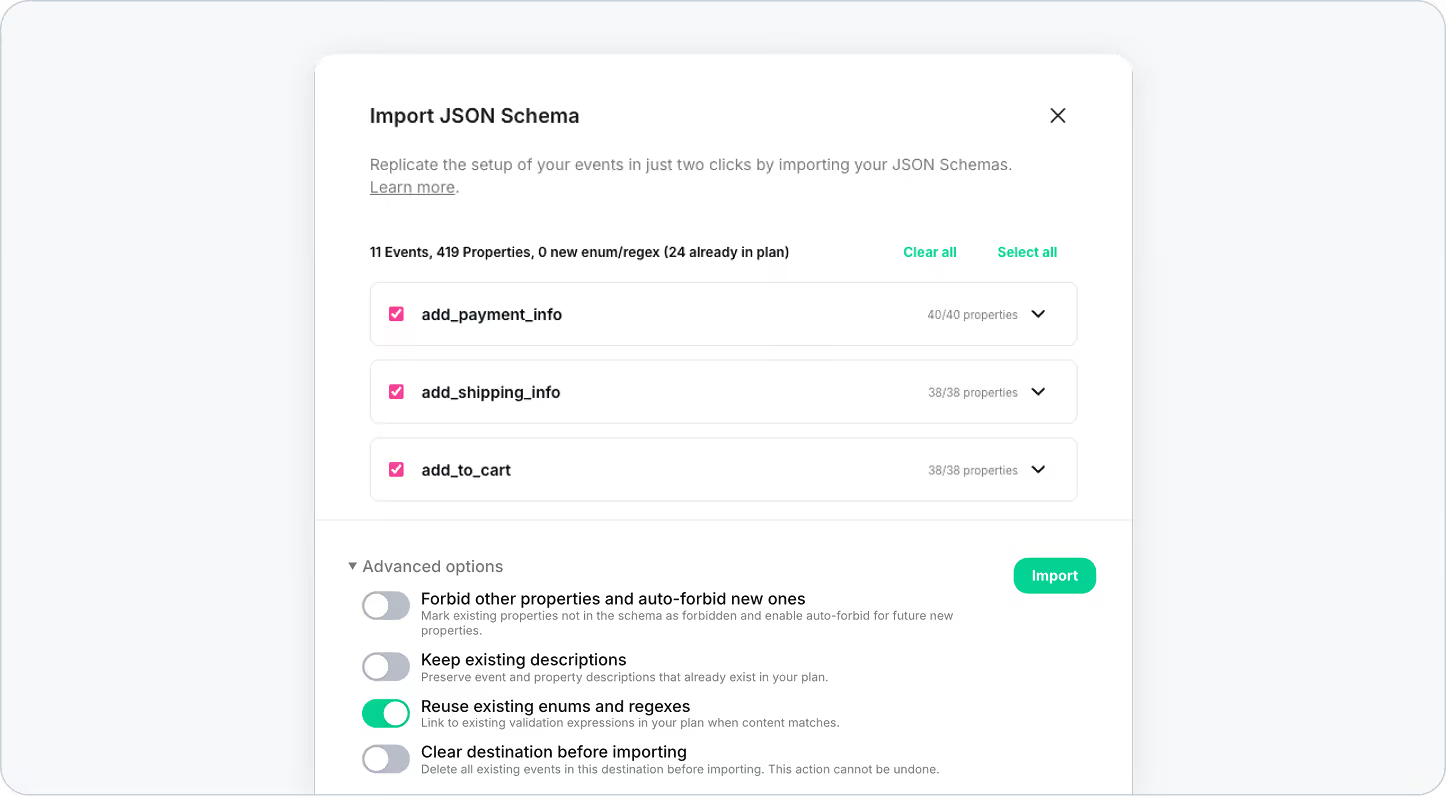
Importing event specs between plans just got a lot more powerful.
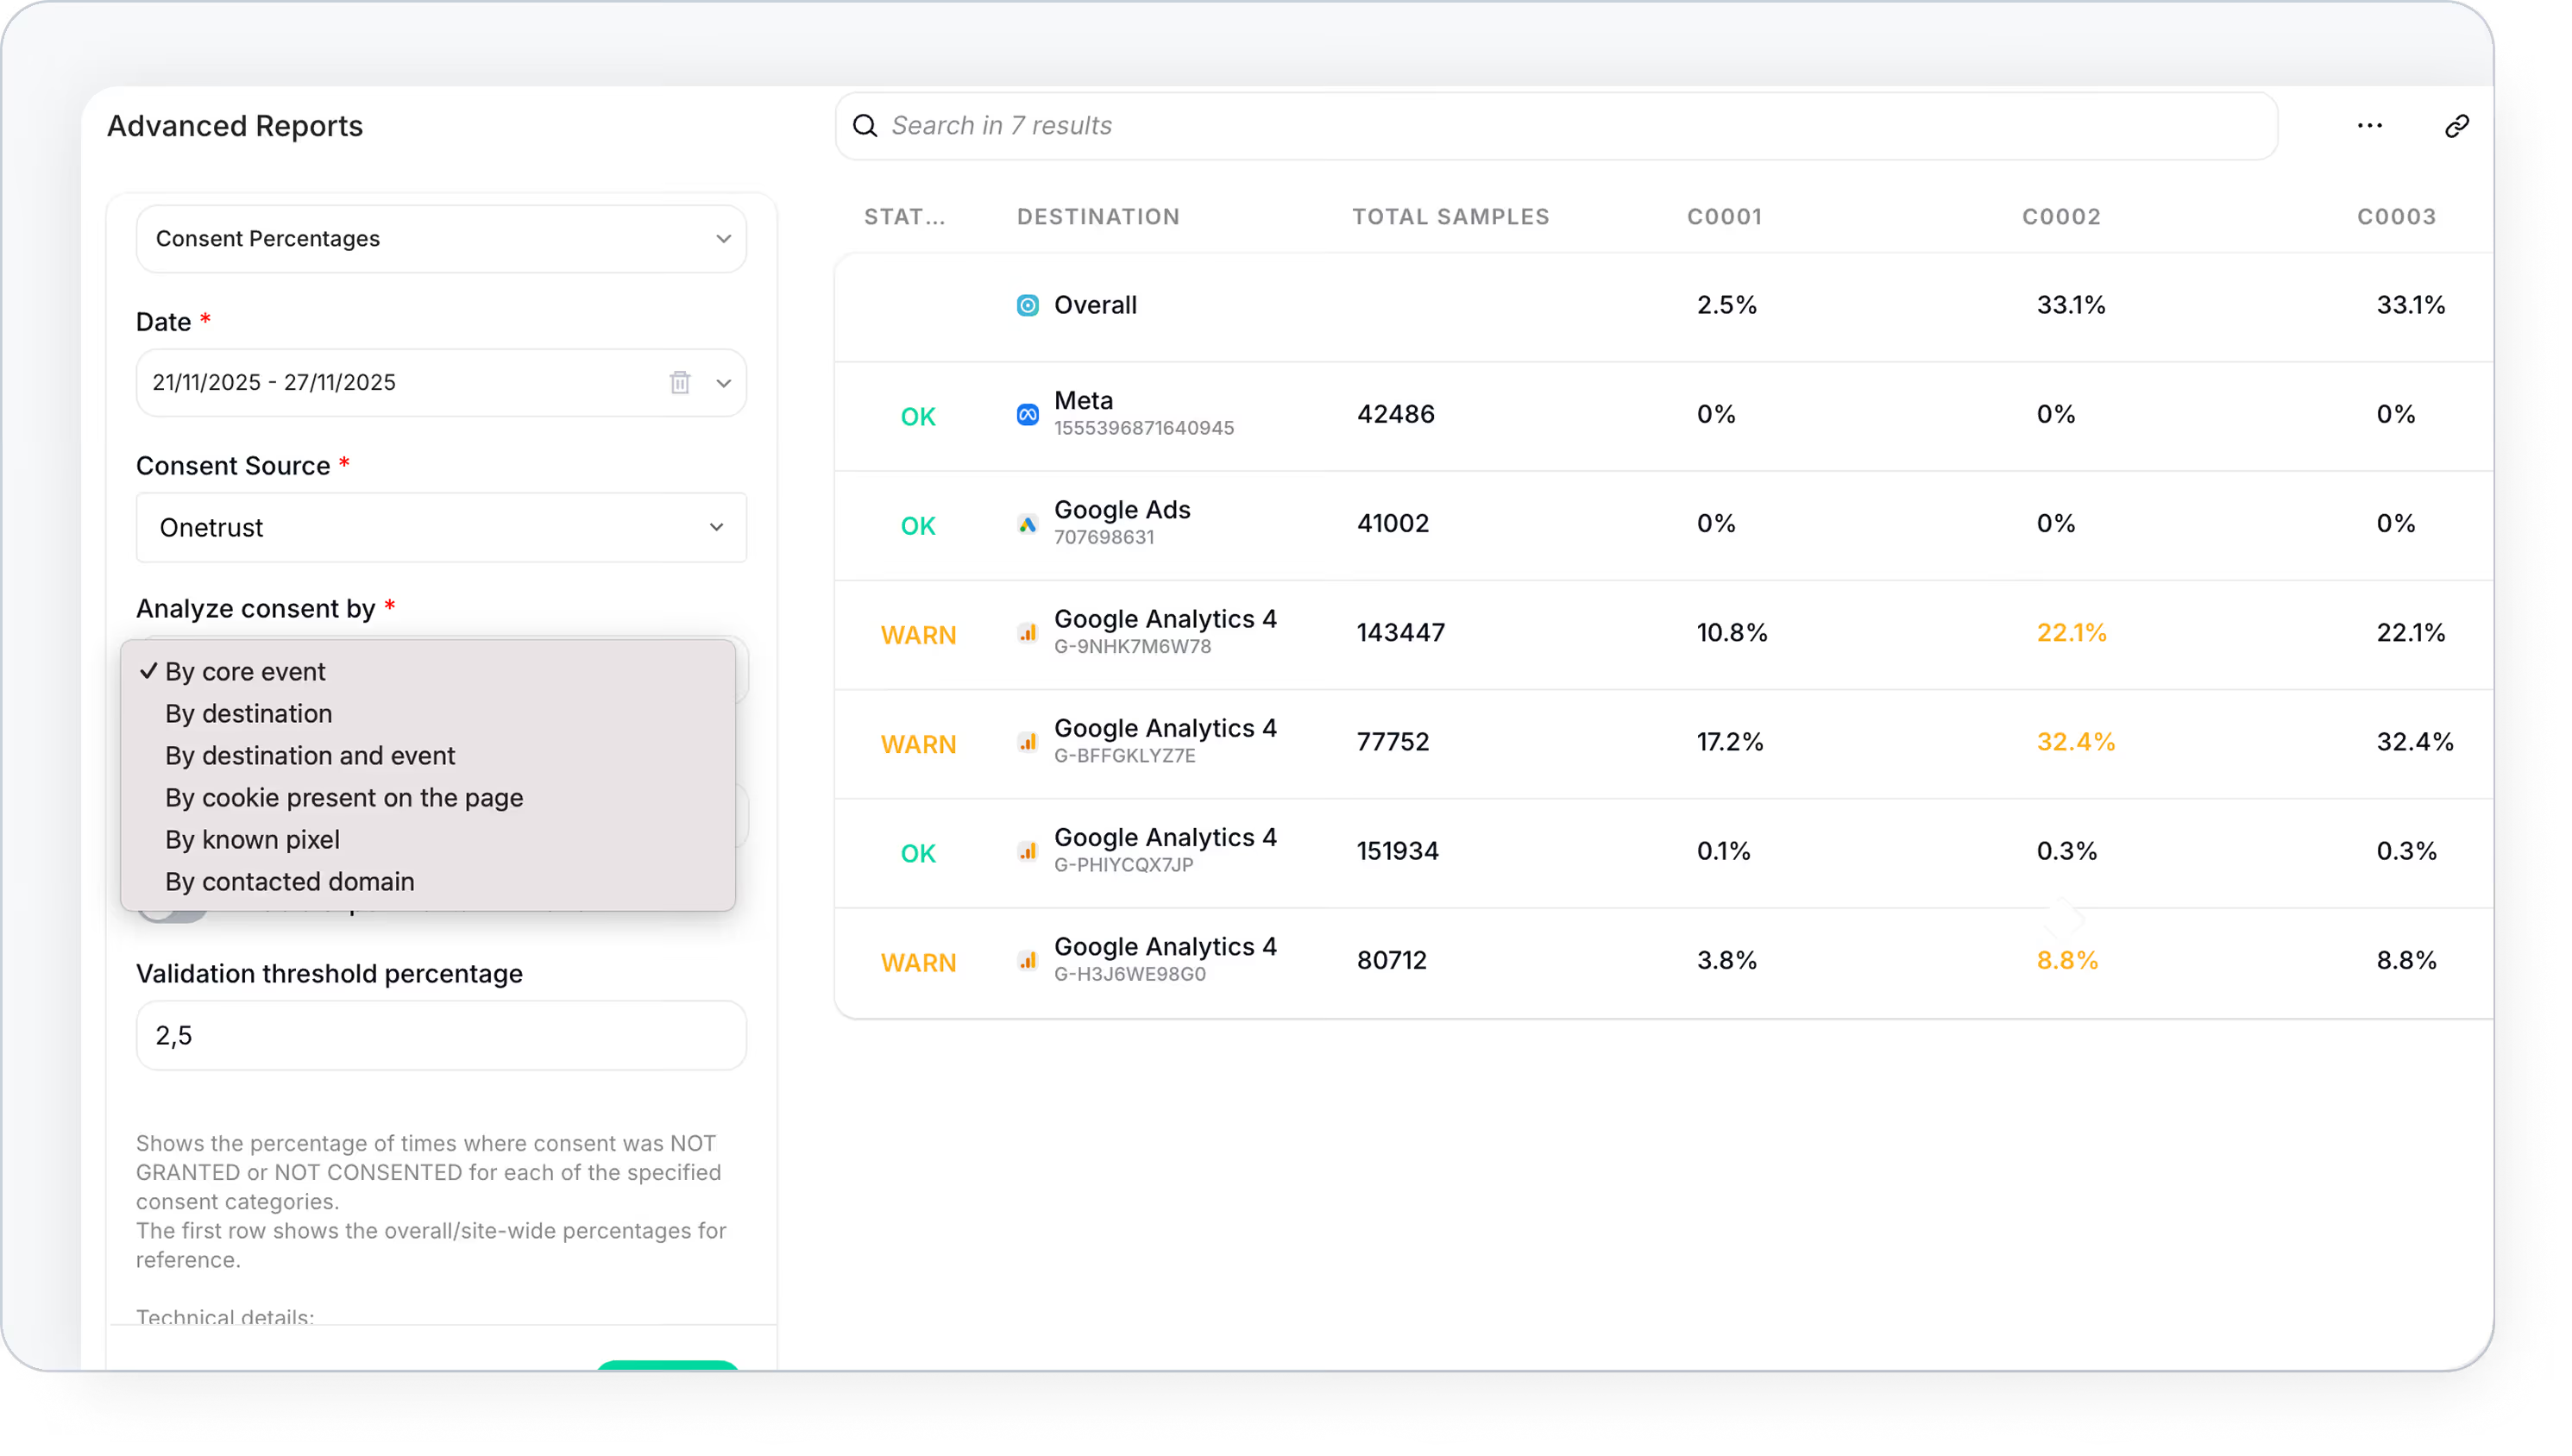
You can now break down the Consent Percentage Report in a much more actionable way to move from “is consent broken?” to “exactly where, how, and why.
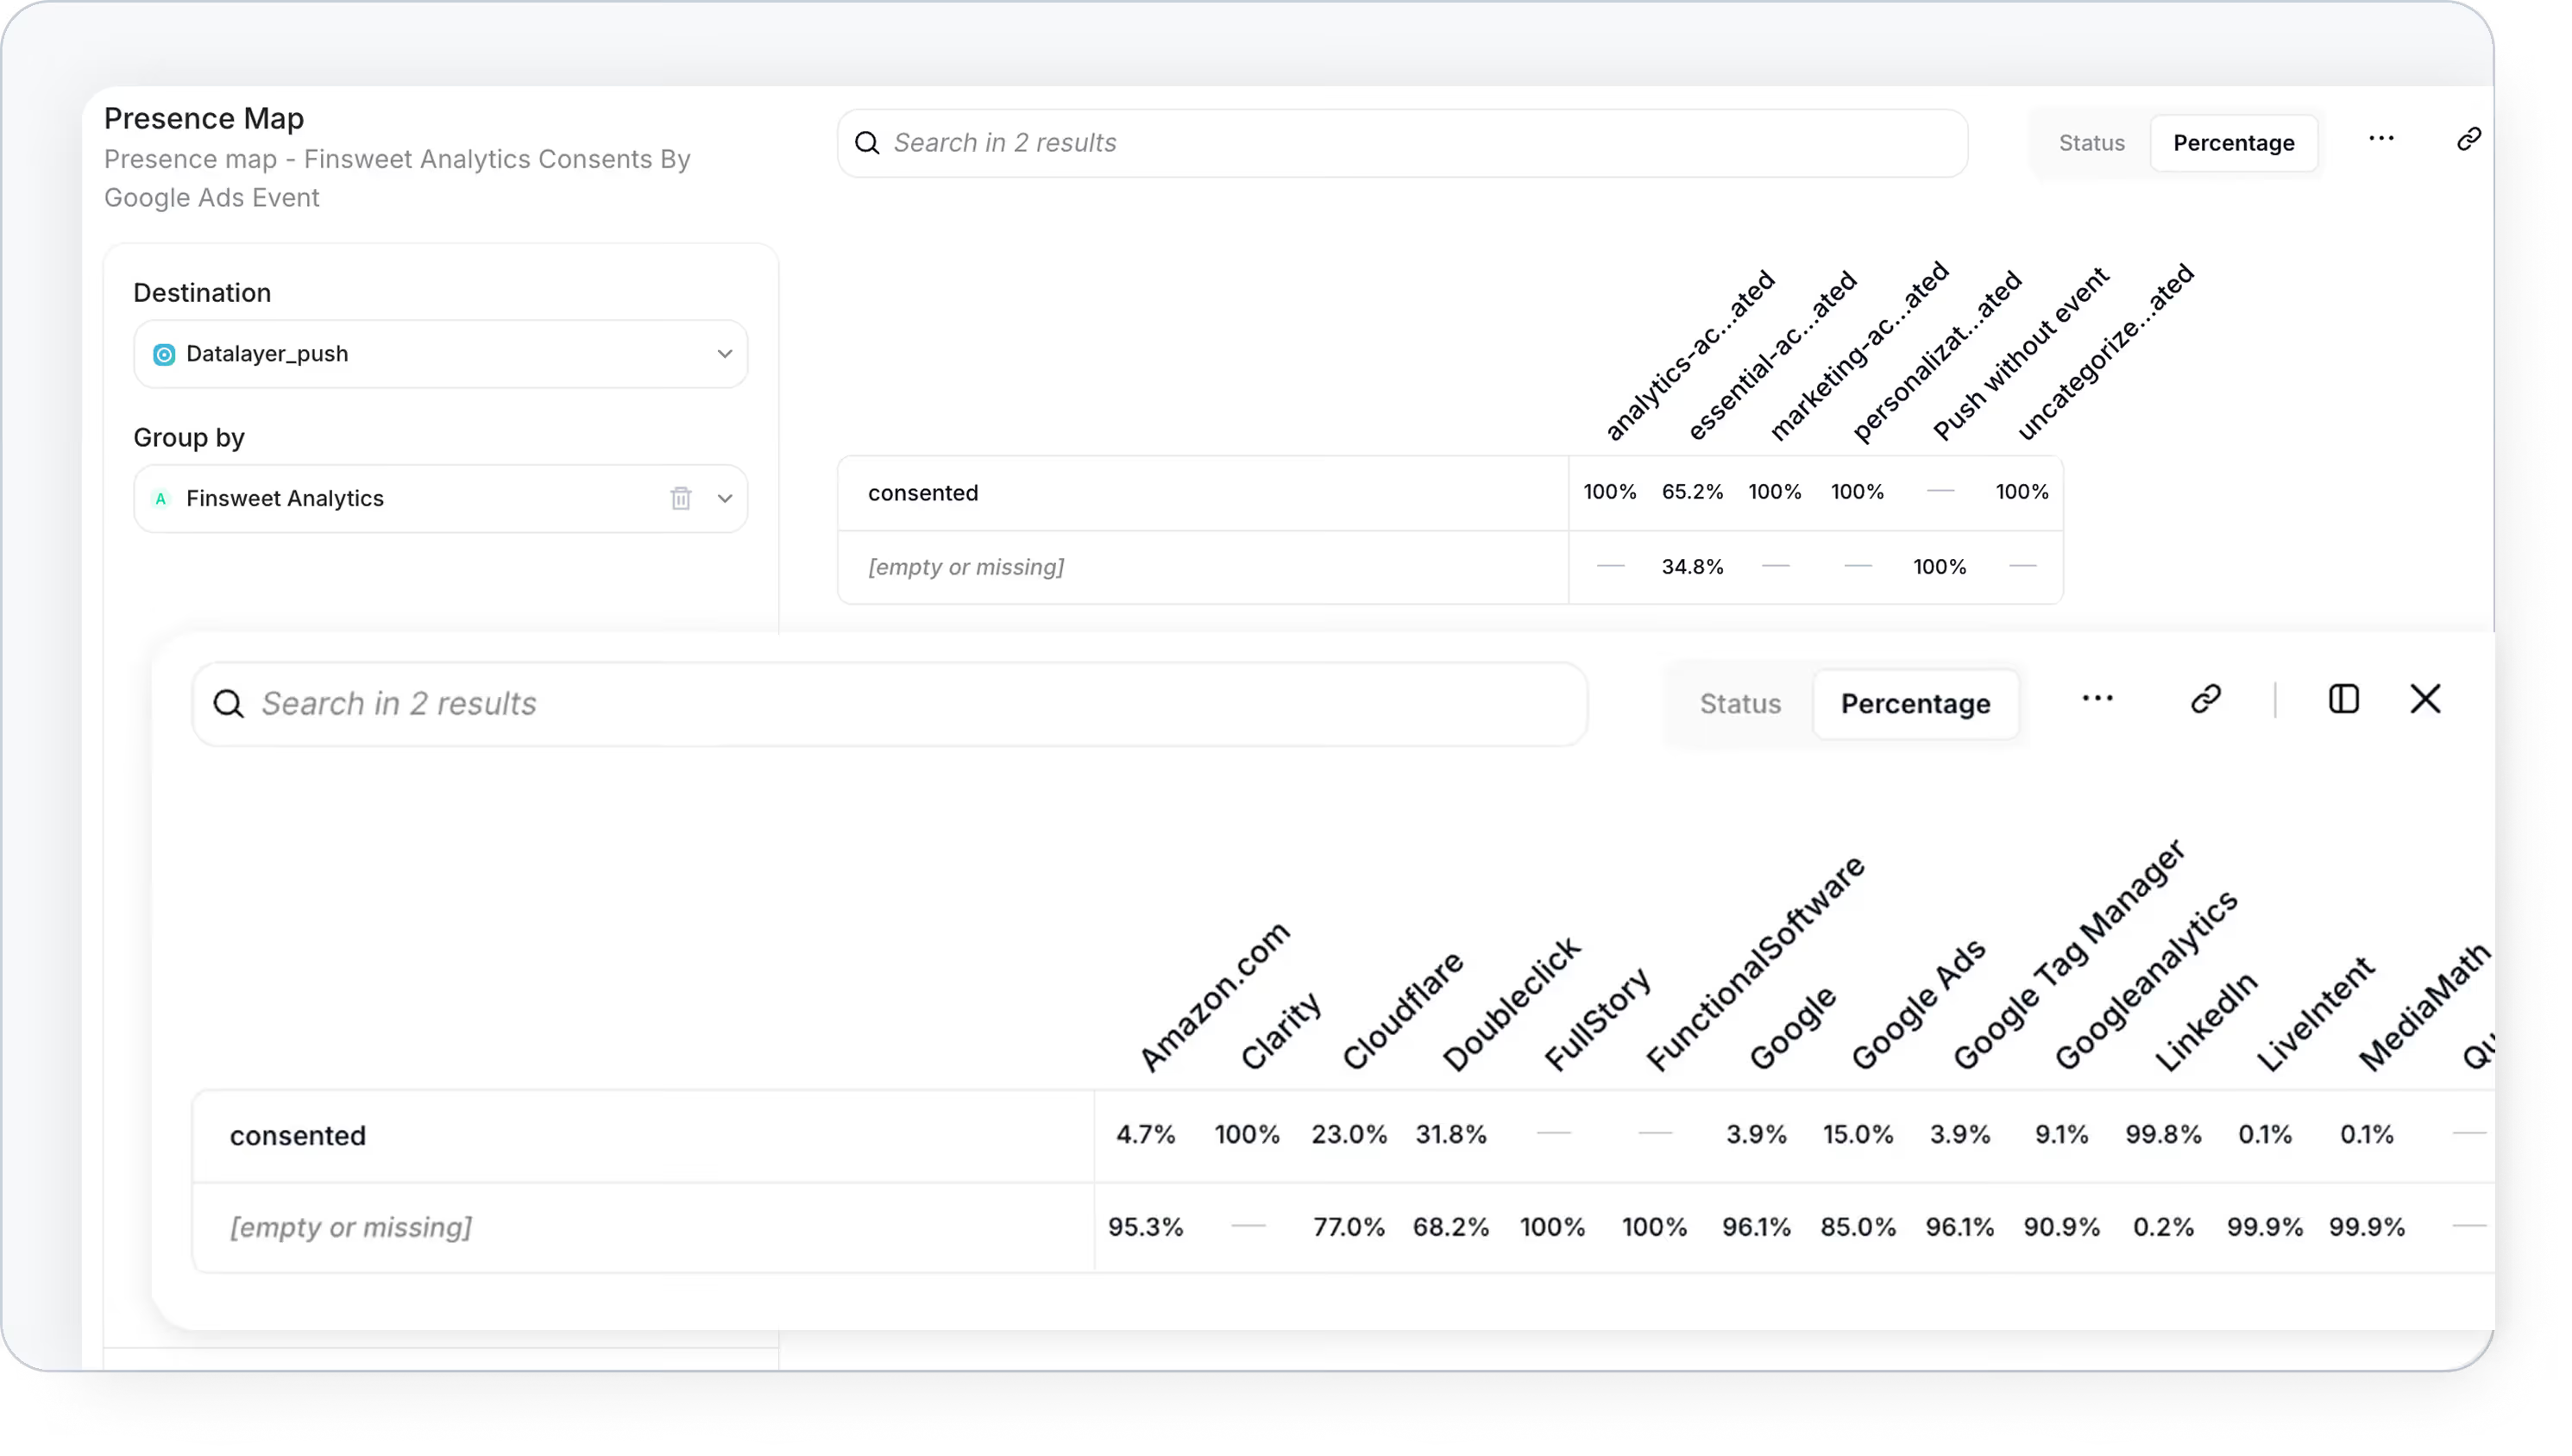
The Presence Map now shows more than just what’s present.
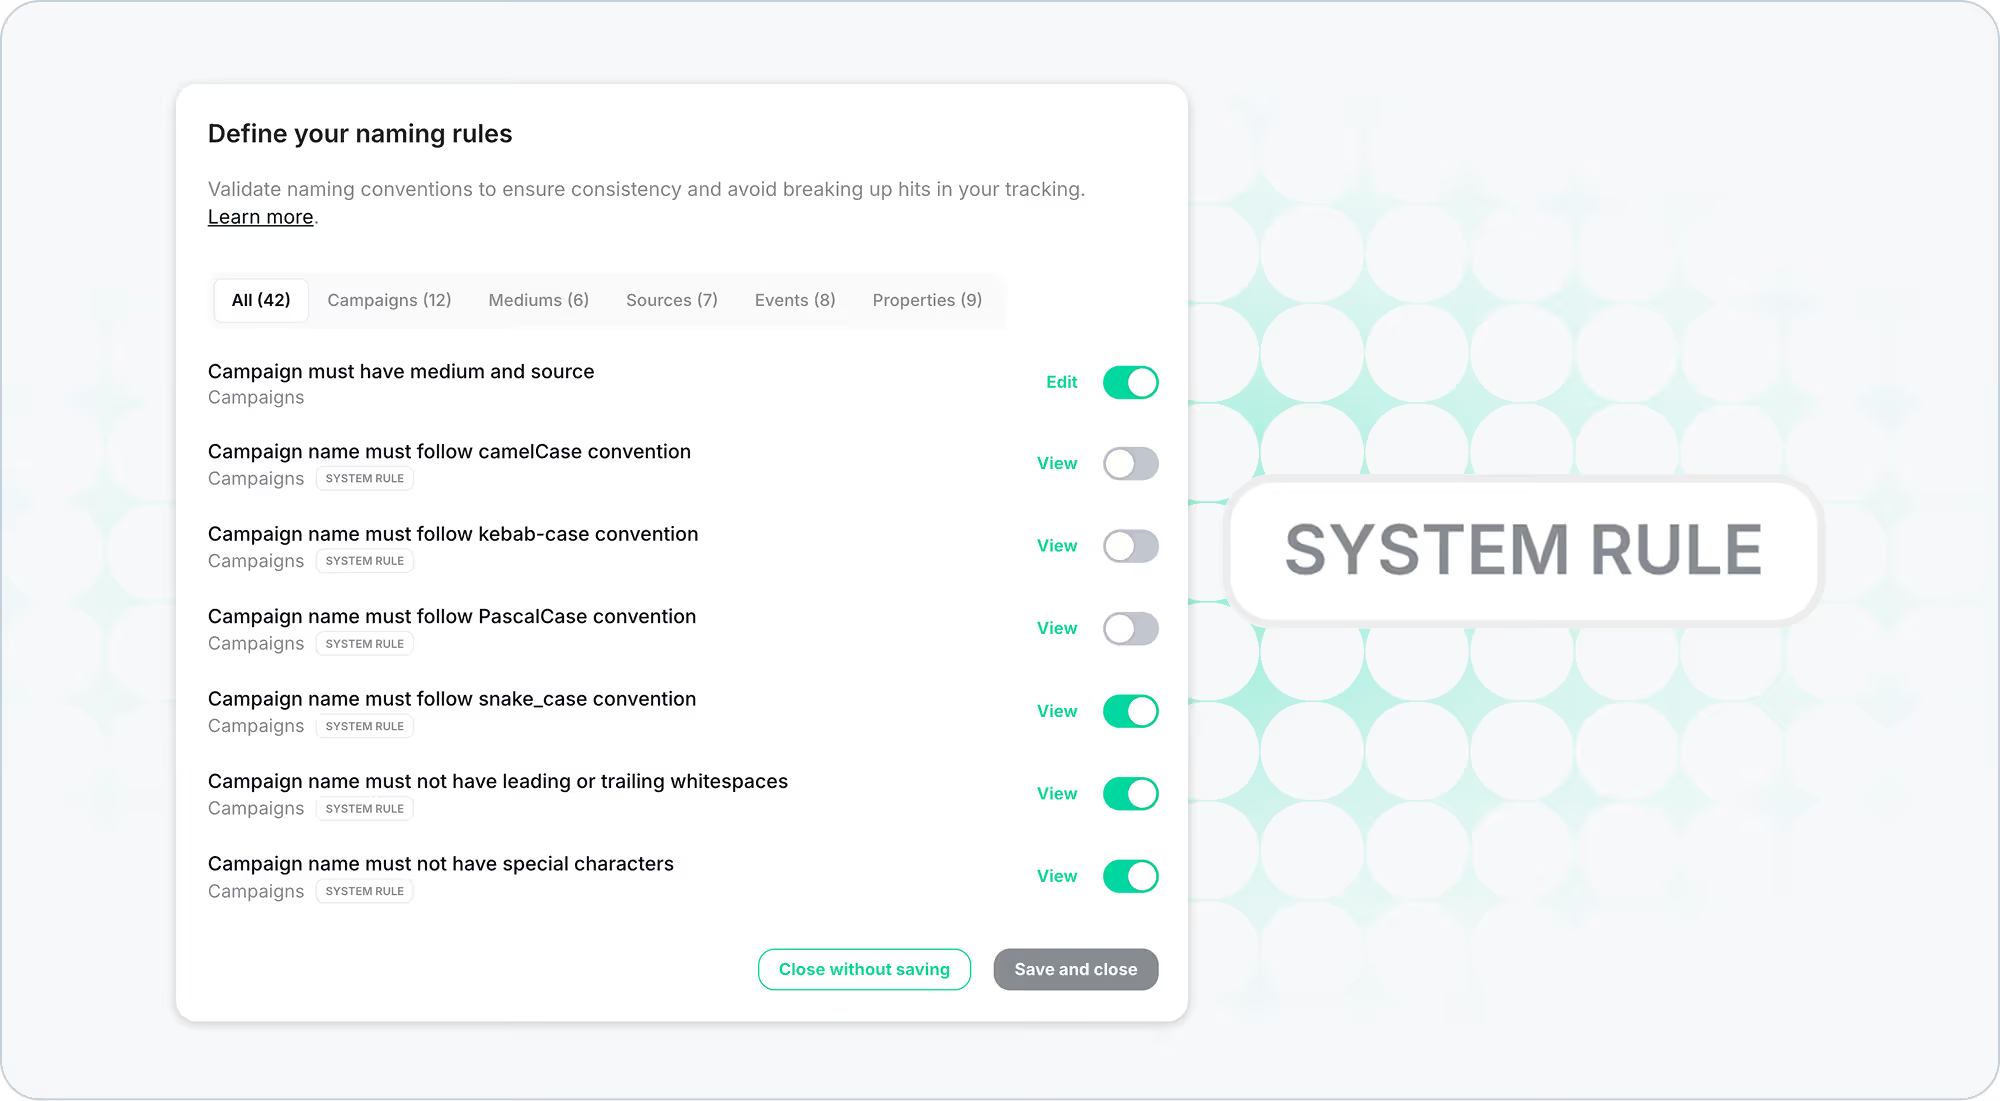
We’ve added new preset rules for naming conventions, covering common patterns like kebab-cases, camelCase, and more.
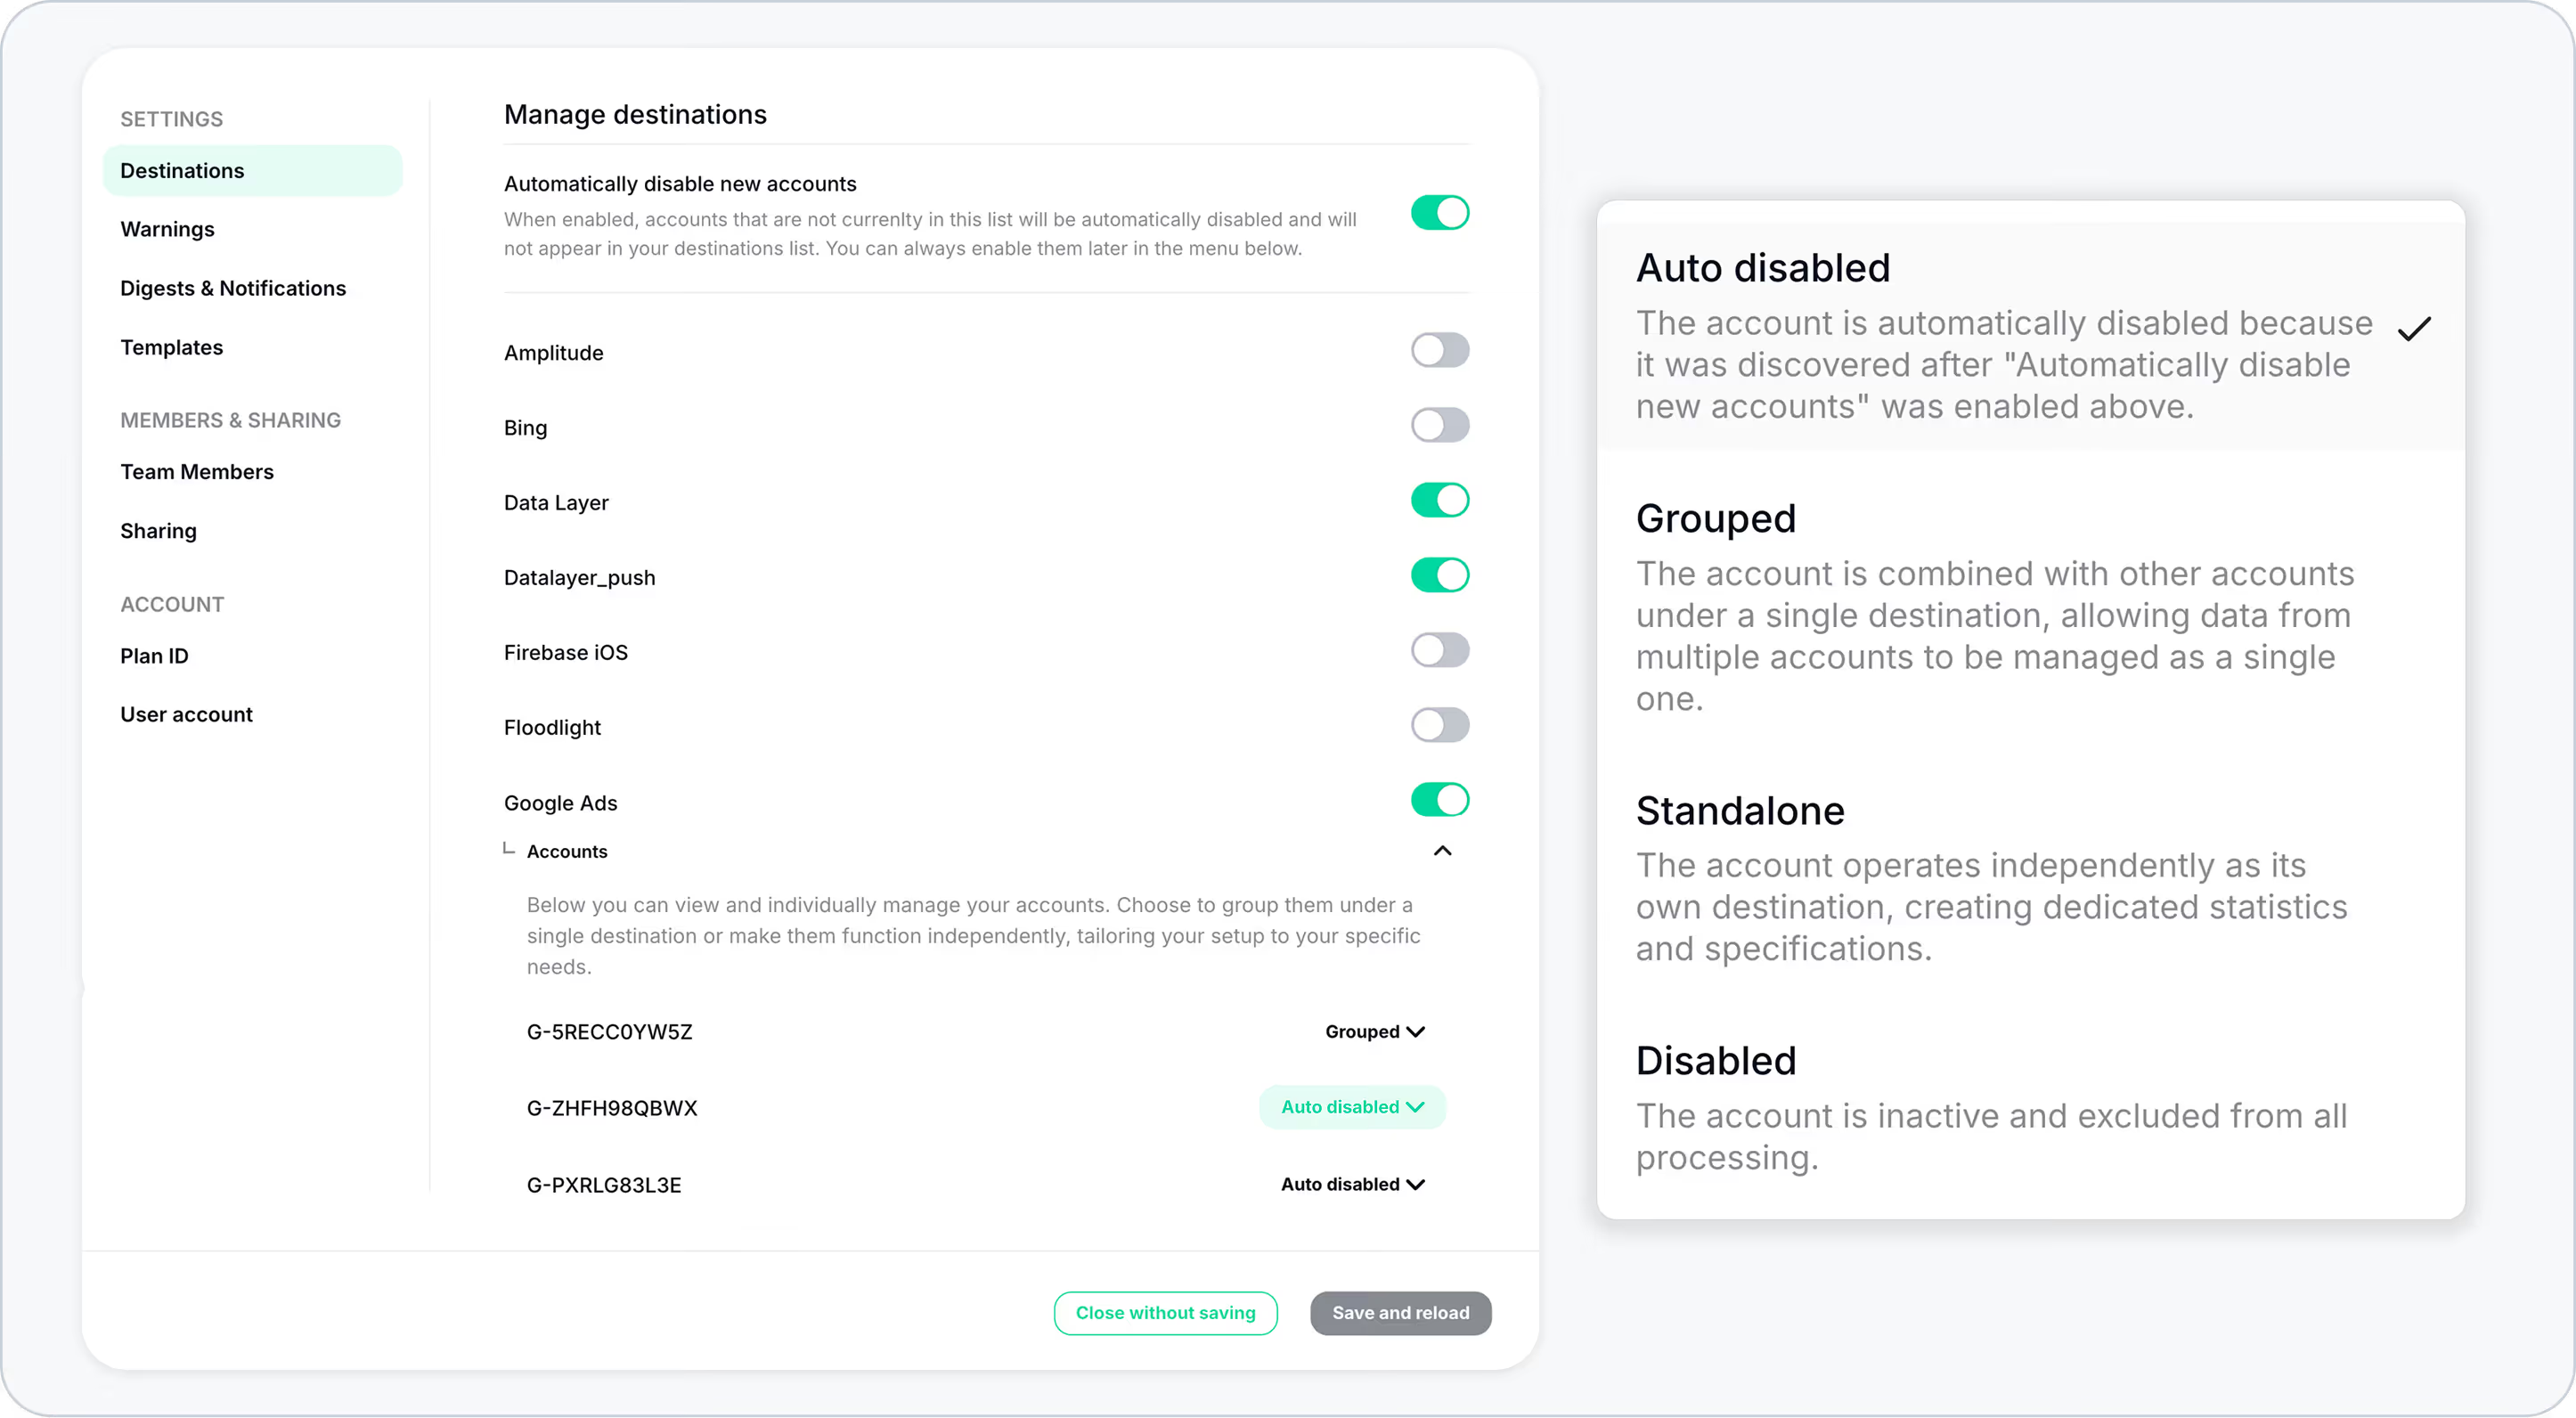
If you only care about certain destinations (for example, your GA4 accounts), this one’s for you.
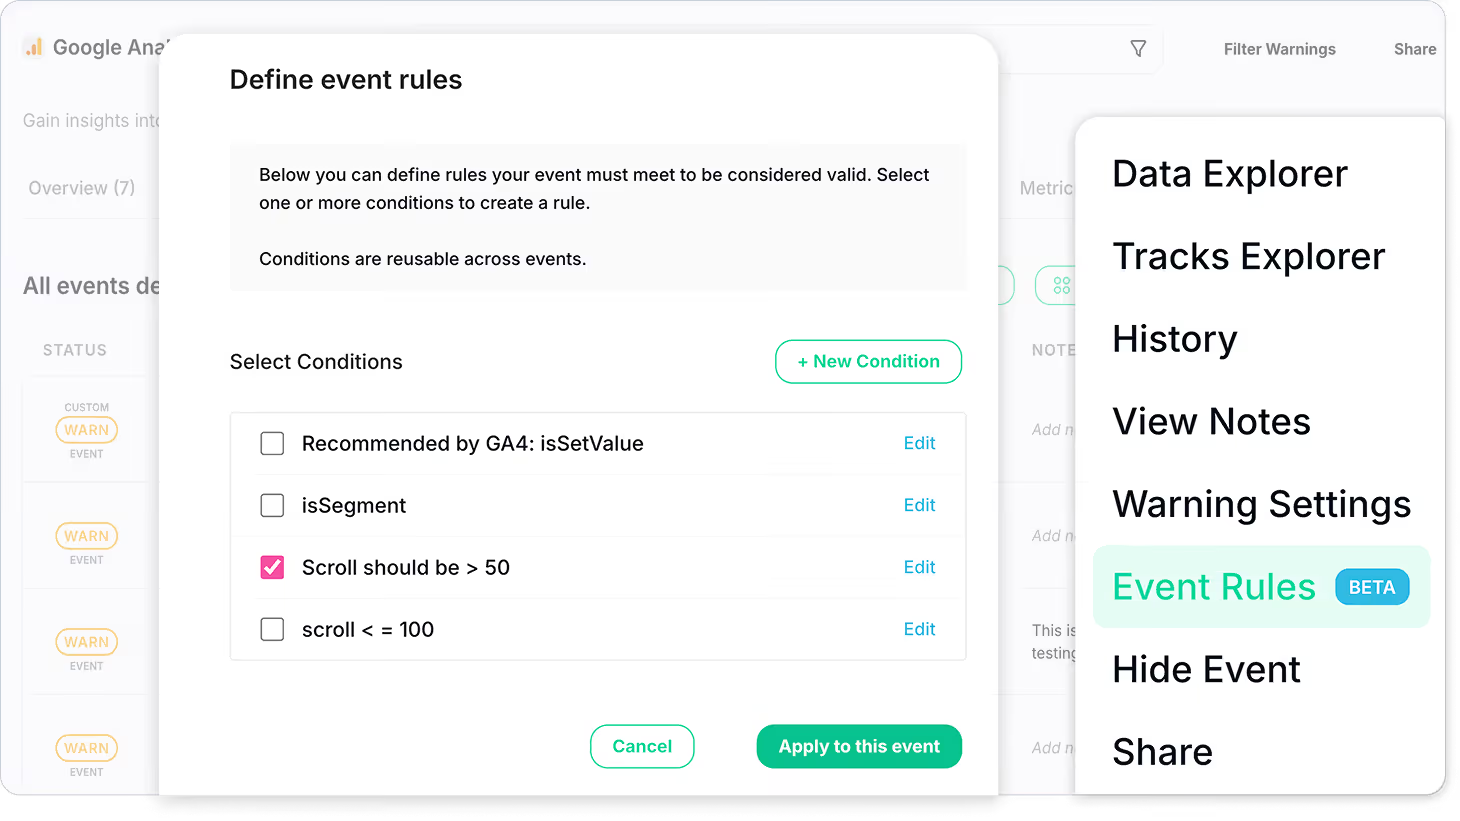
Forget about complex regex or static functions. We’ve introduced interactive Event Rules: a flexible way to create and manage conditions tailored to your needs.
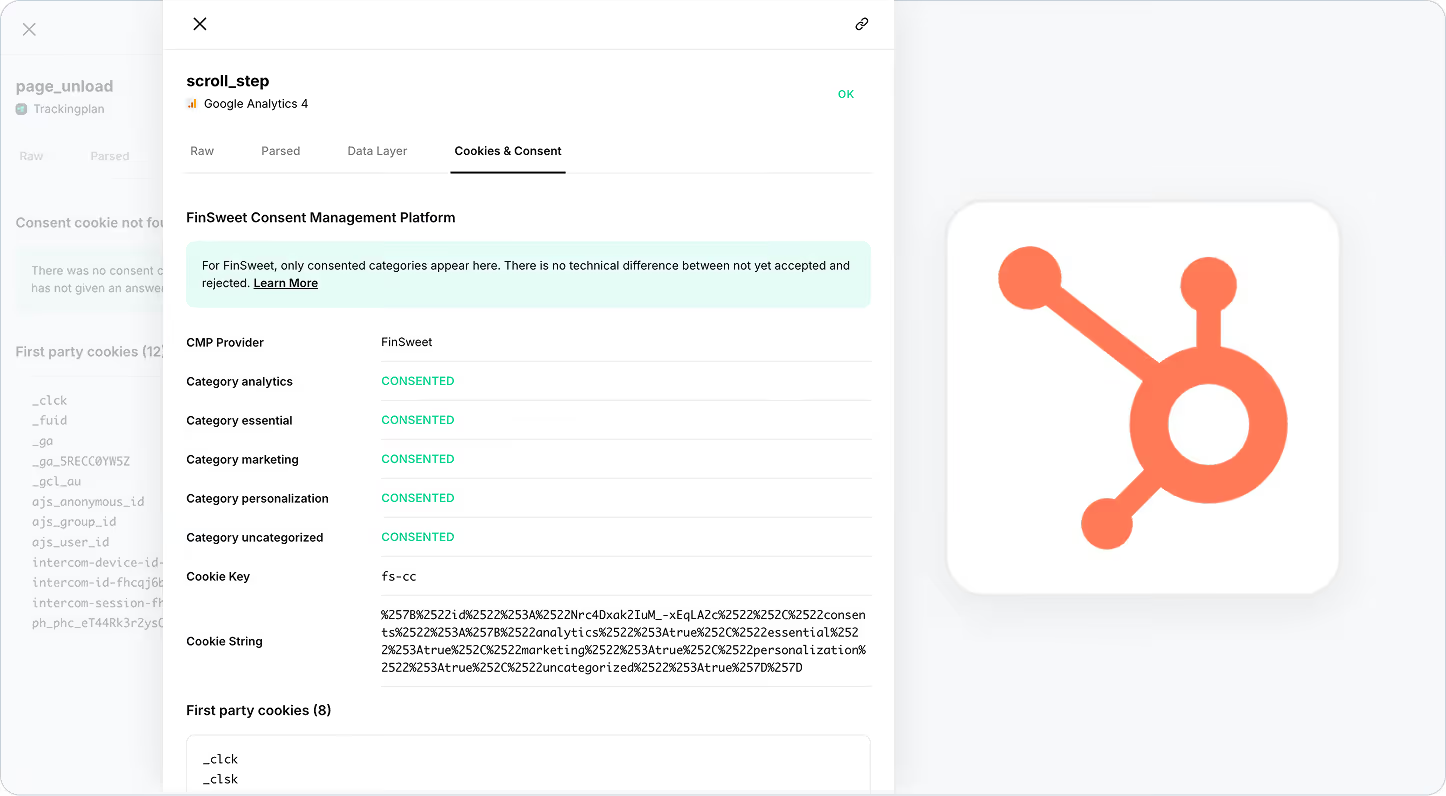
Our JS SDK now fully supports HubSpot CMP cookies, so you can keep your consent signals clean, reliable, and aligned across your entire stack.
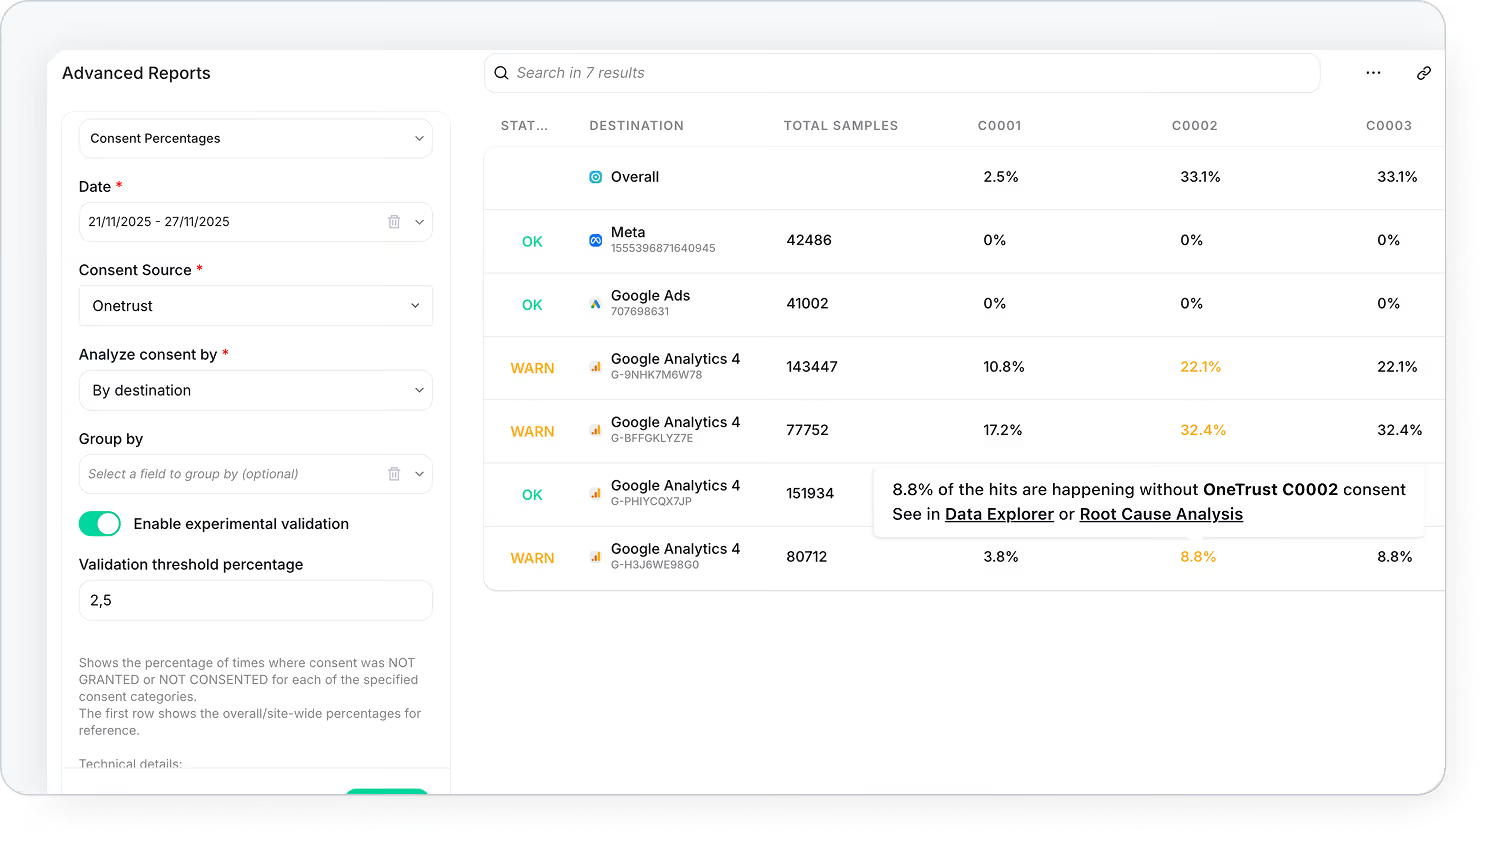
We’ve improved our Consent Percentage Report so you can get the full picture of your cookie & CMP monitoring.
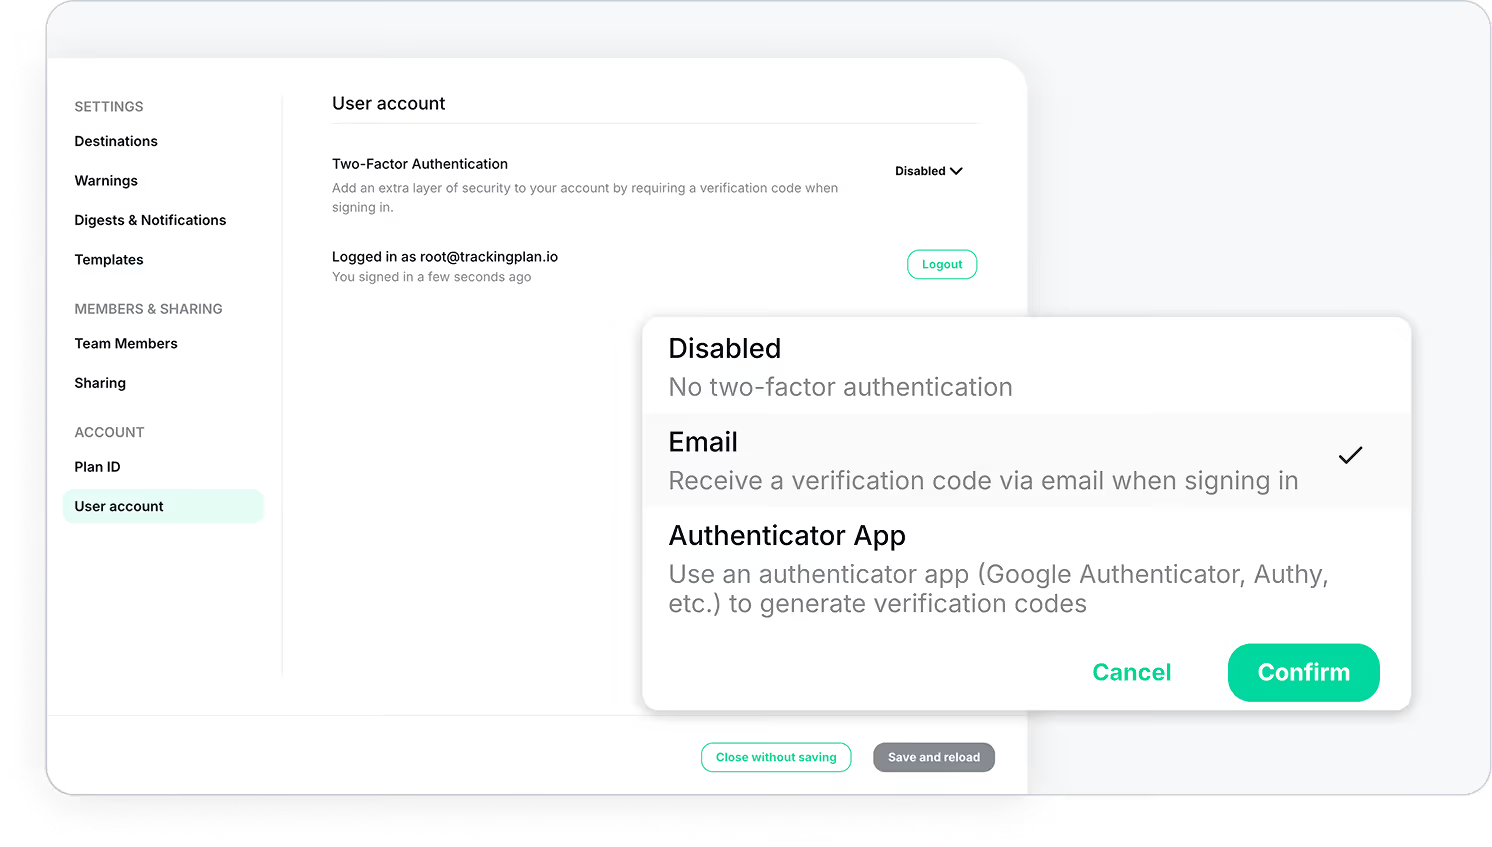
We’ve added support for Two-Factor Authentication to make logins more secure and keep your account safe.
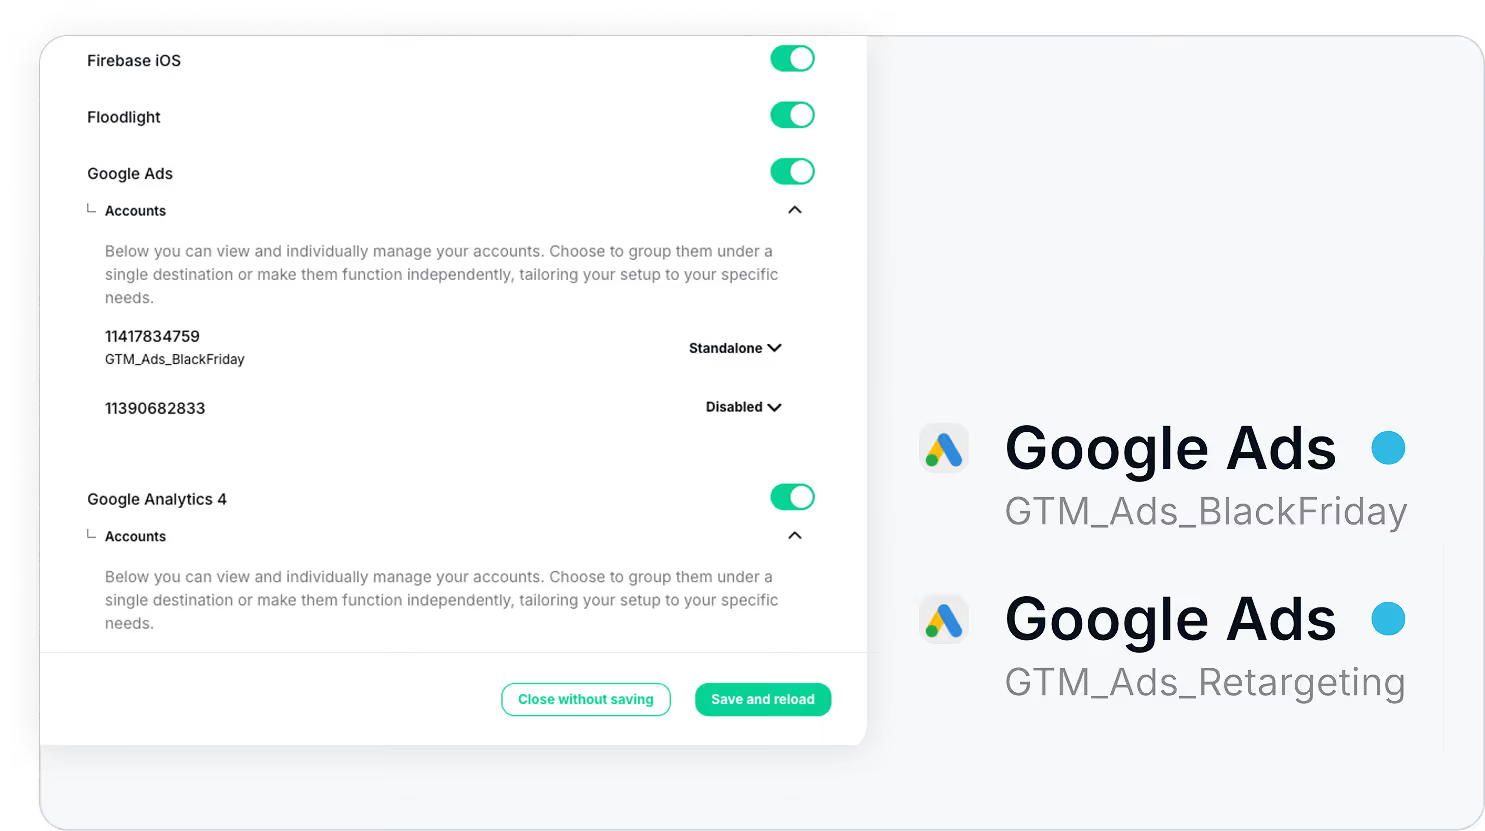
Managing multiple accounts just got simpler. You can now assign aliases to standalone accounts for easier identification and control.
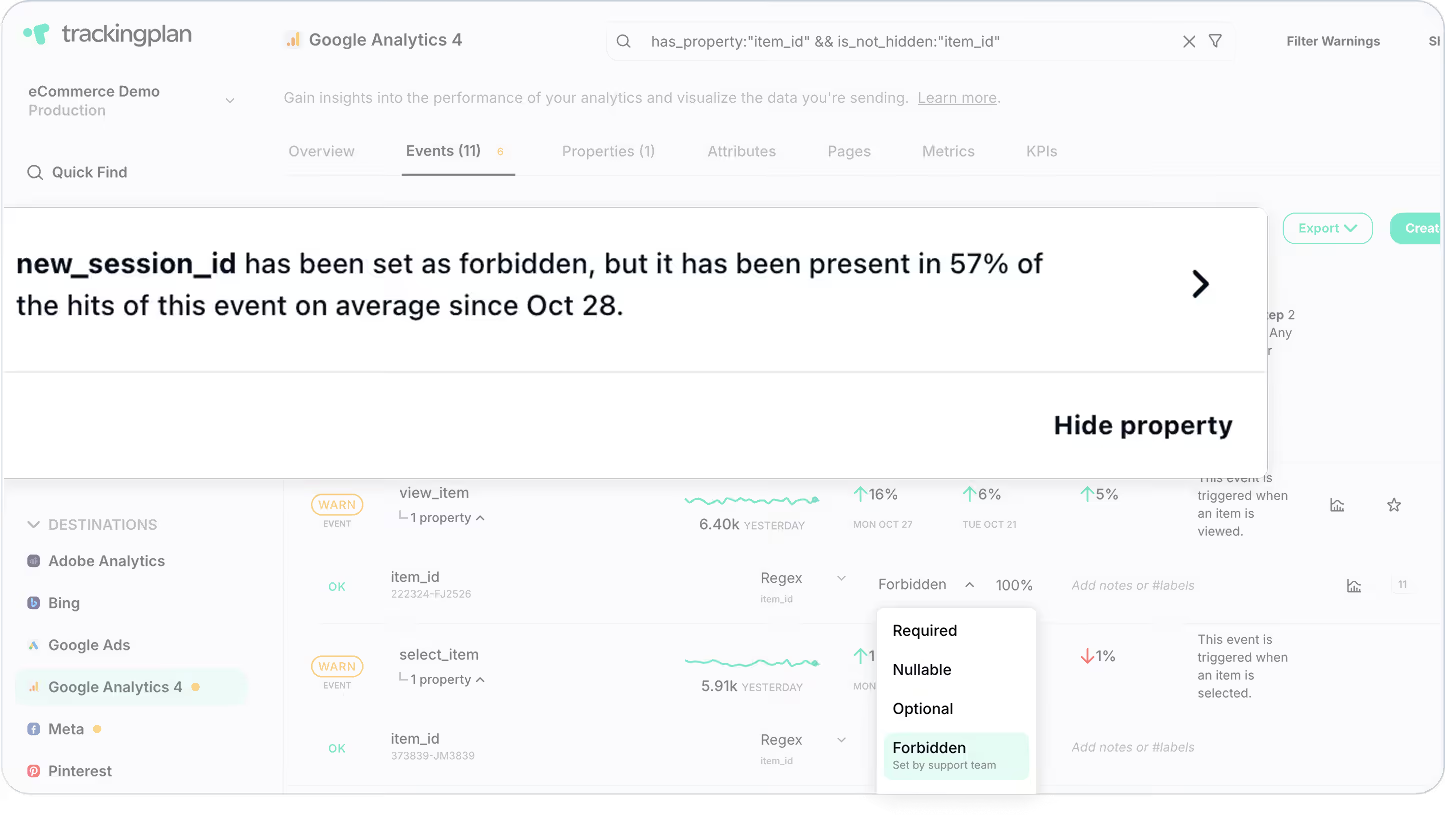
Be instantly alerted whenever unexpected properties sneak into your events with instant warnings for out-of-spec properties.
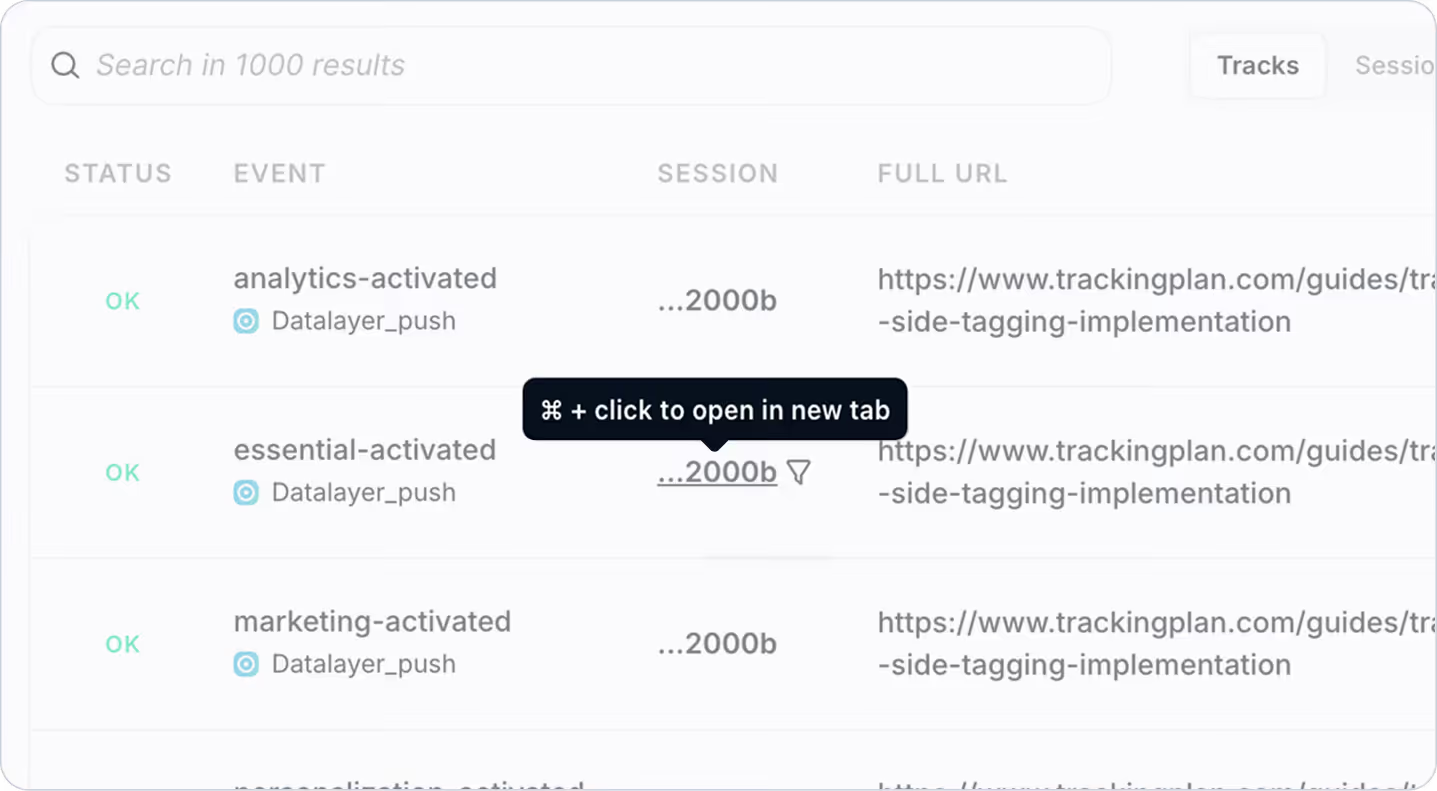
View multiple sessions simultaneously, compare sessions side by side to identify patterns or discrepancies, and perform deeper analysis — all without interrupting your current workflow.
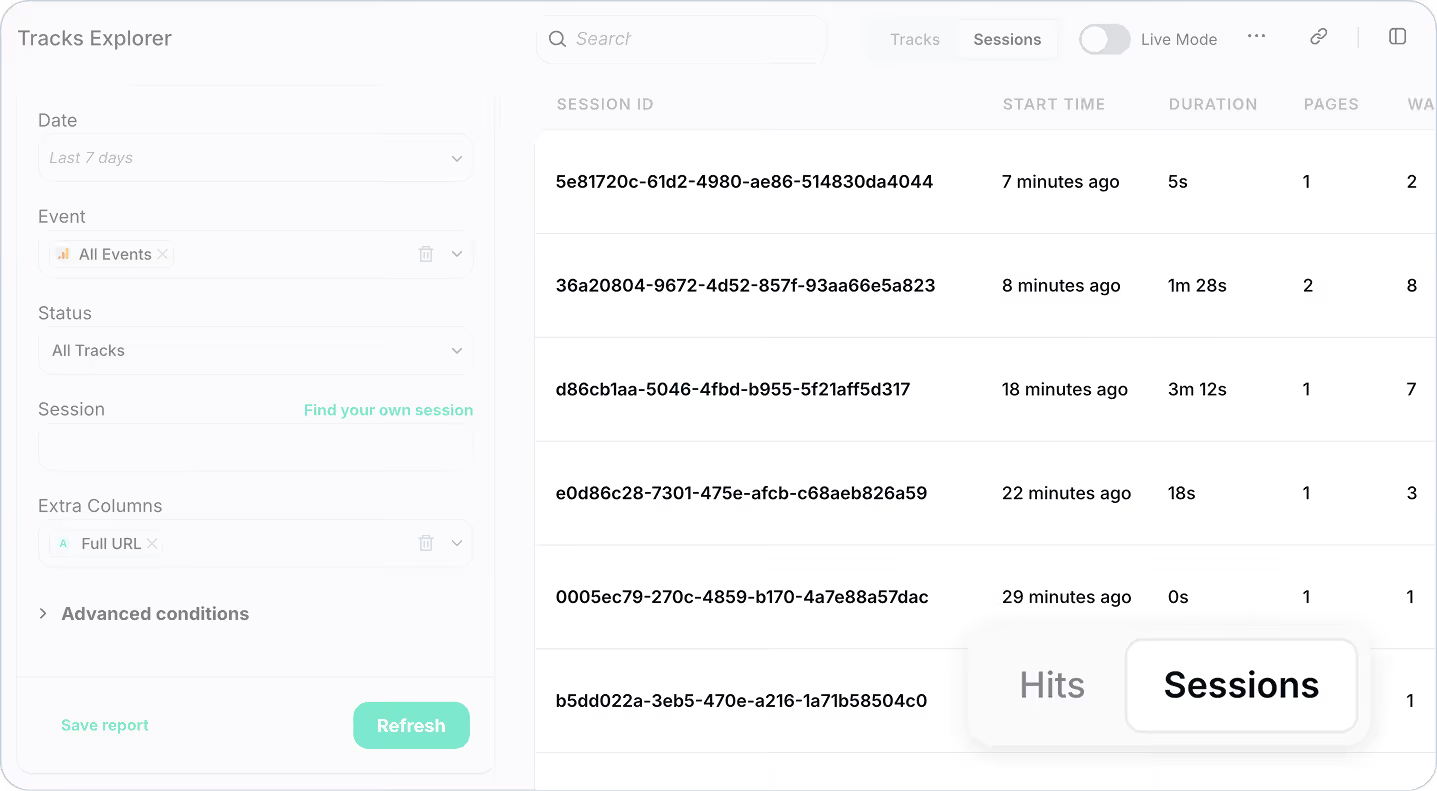
You can now switch seamlessly between individual tracks and complete sessions when analyzing your data in your Tracks Explorer.

Trackingplan now supports Branch.io in our app SDKs.
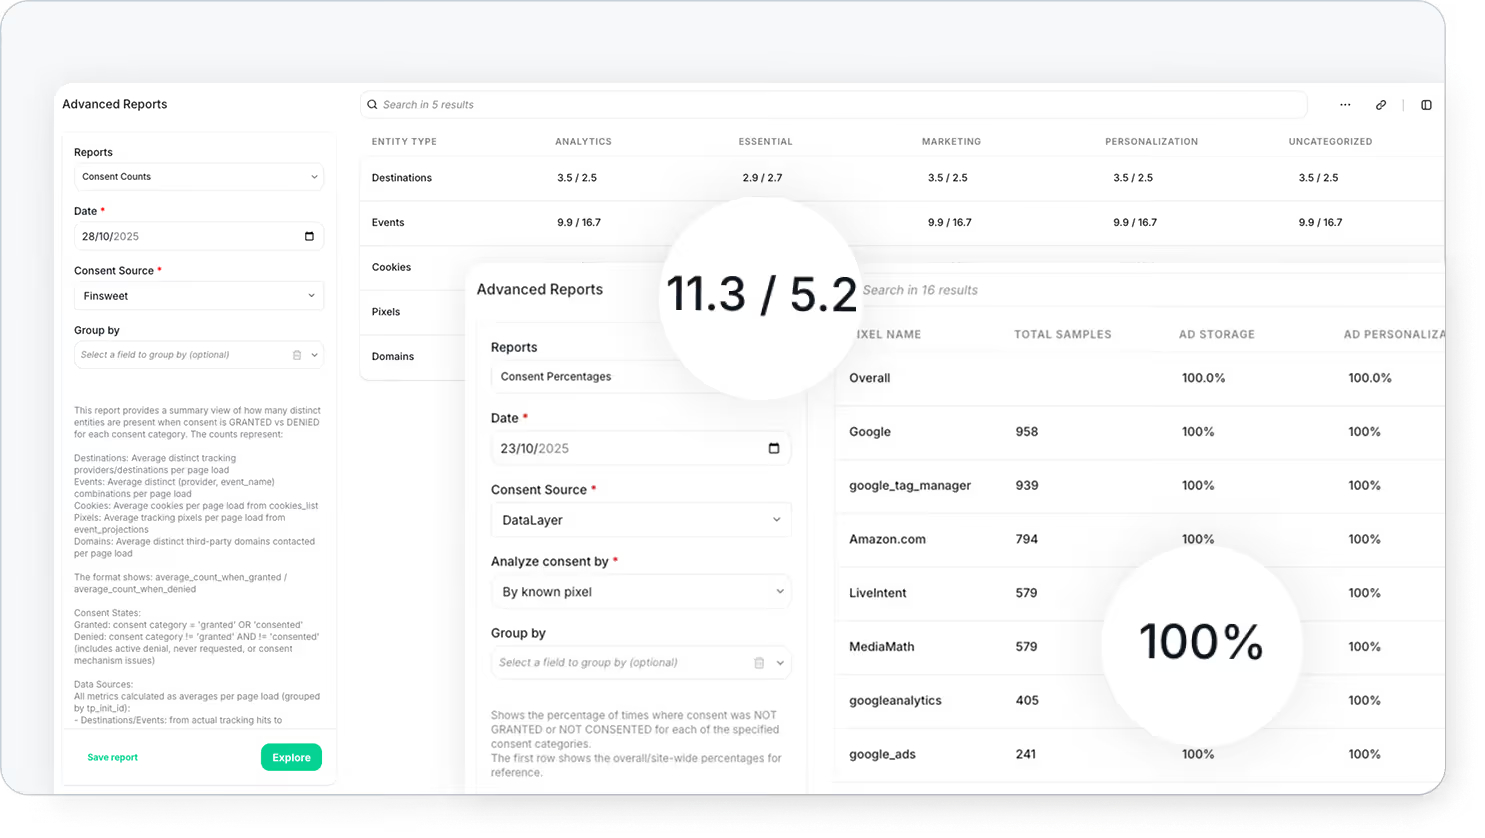
Trackingplan just got more powerful for consent monitoring.
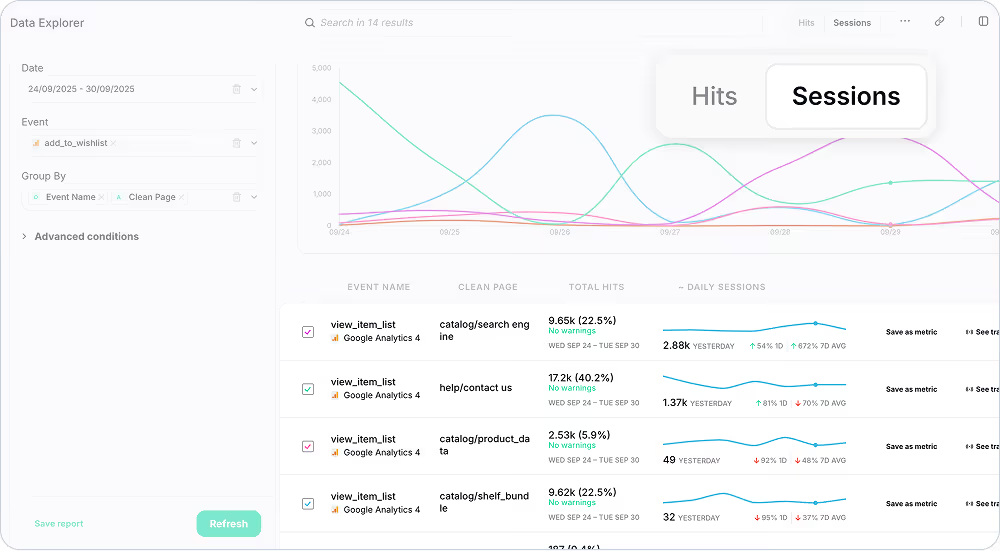
Now you can also view your events by unique sessions alongside hits. All in the same Data Explorer view you know and love.

Trackingplan now helps you monitor cookie consent with ease, ensuring your Consent Management Platform (CMP) works correctly and your analytics stay privacy-compliant.
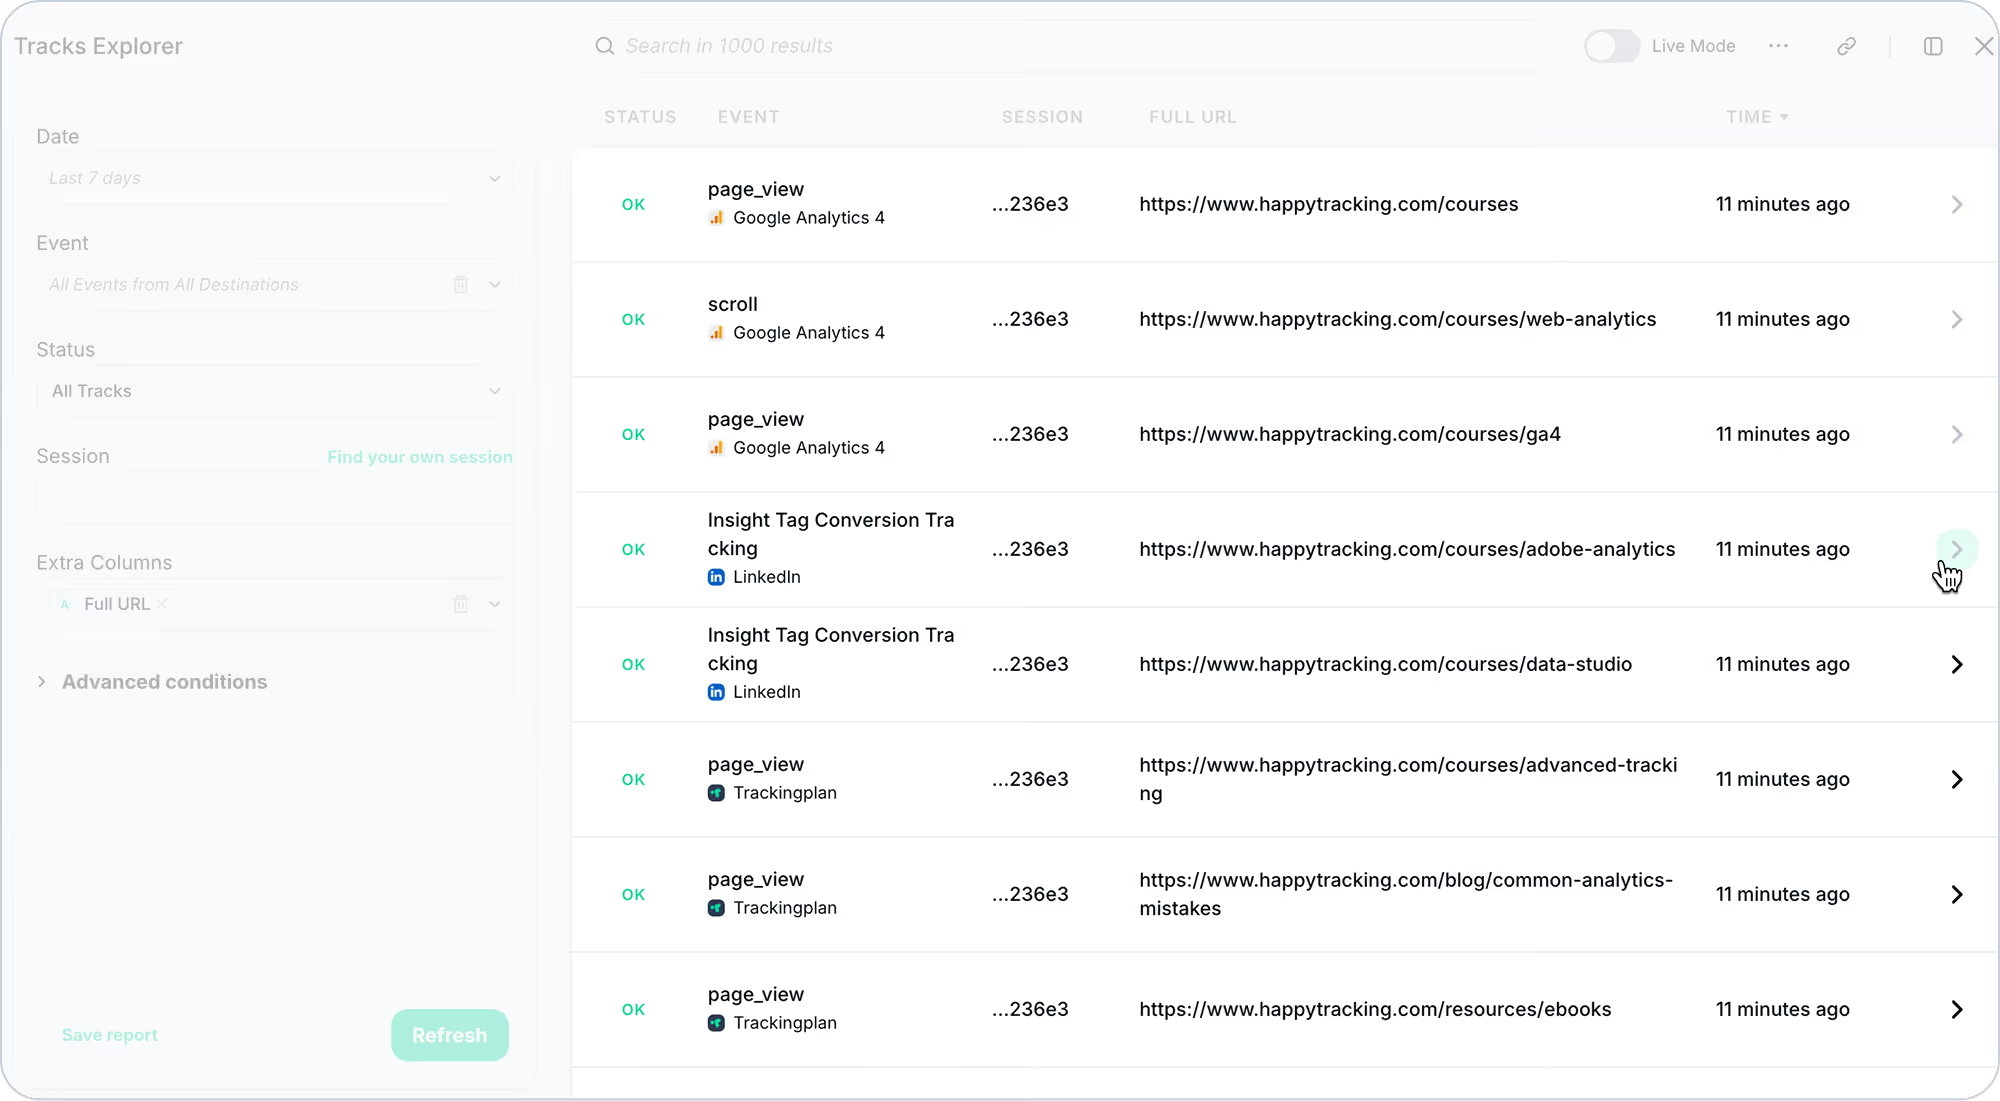
Tracking and debugging just became smoother.
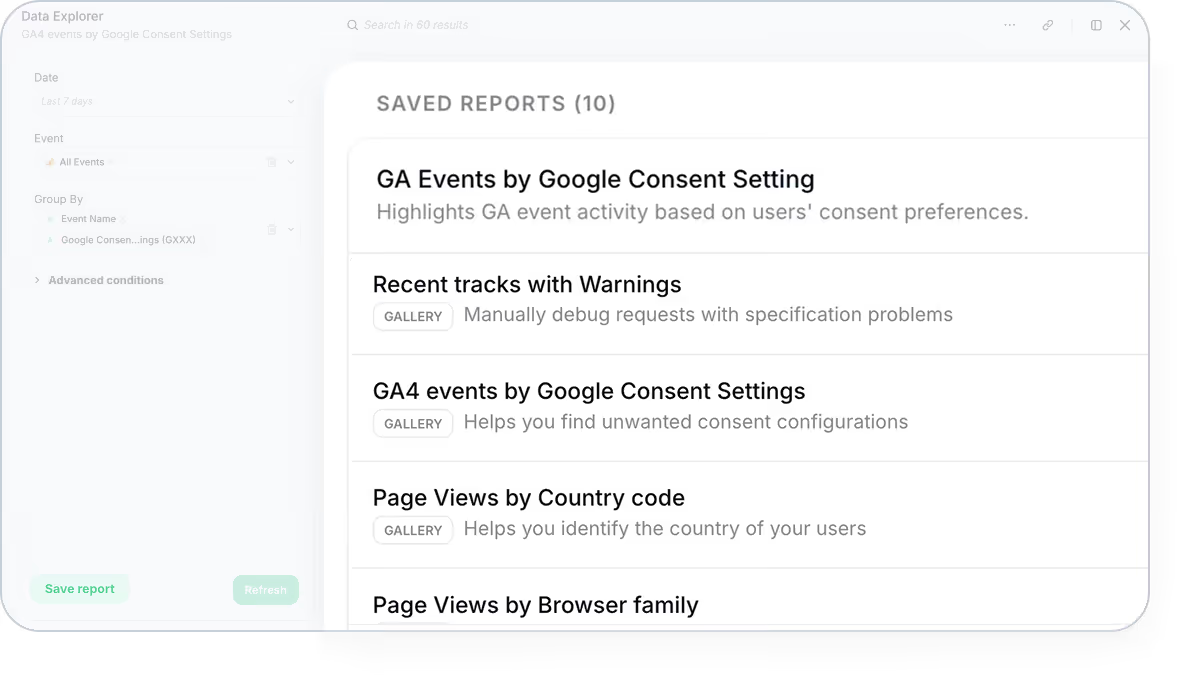
Save and share your custom report views in Trackingplan with Saved Reports—no more rebuilding filters or digging through notes.

We’ve upgraded our traffic monitoring system to make it easier to reliably detect issues in end-of-funnel events.
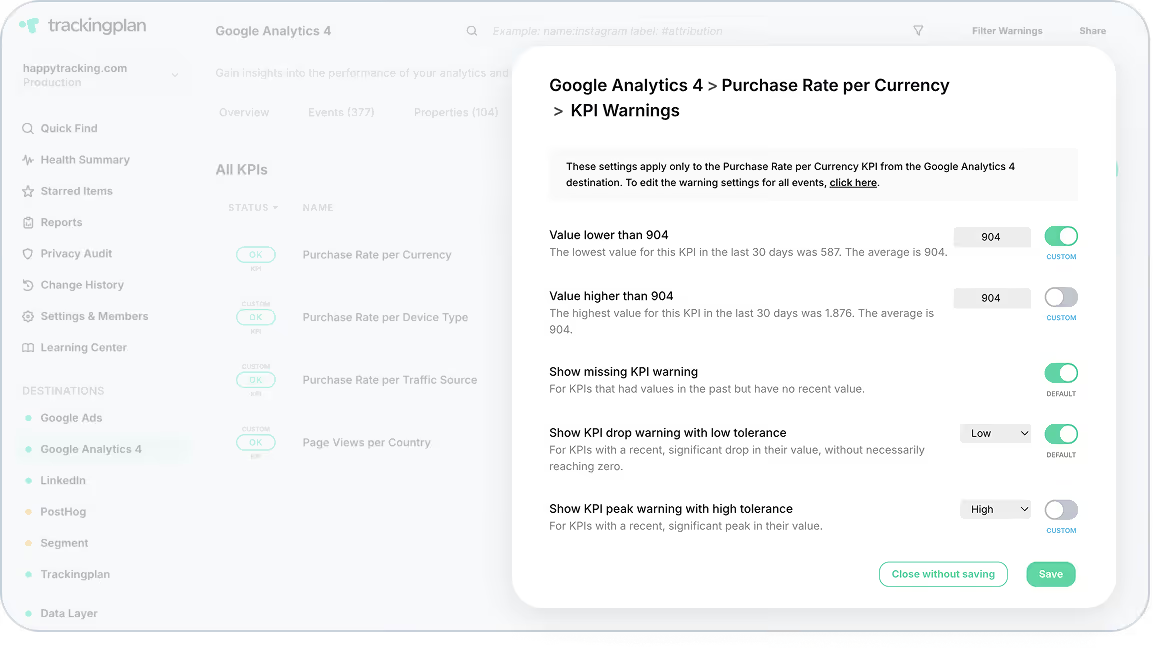
You can now customize the tolerance levels of your KPIs — giving you full control over when warnings are triggered for traffic drops, peaks, and missing values.
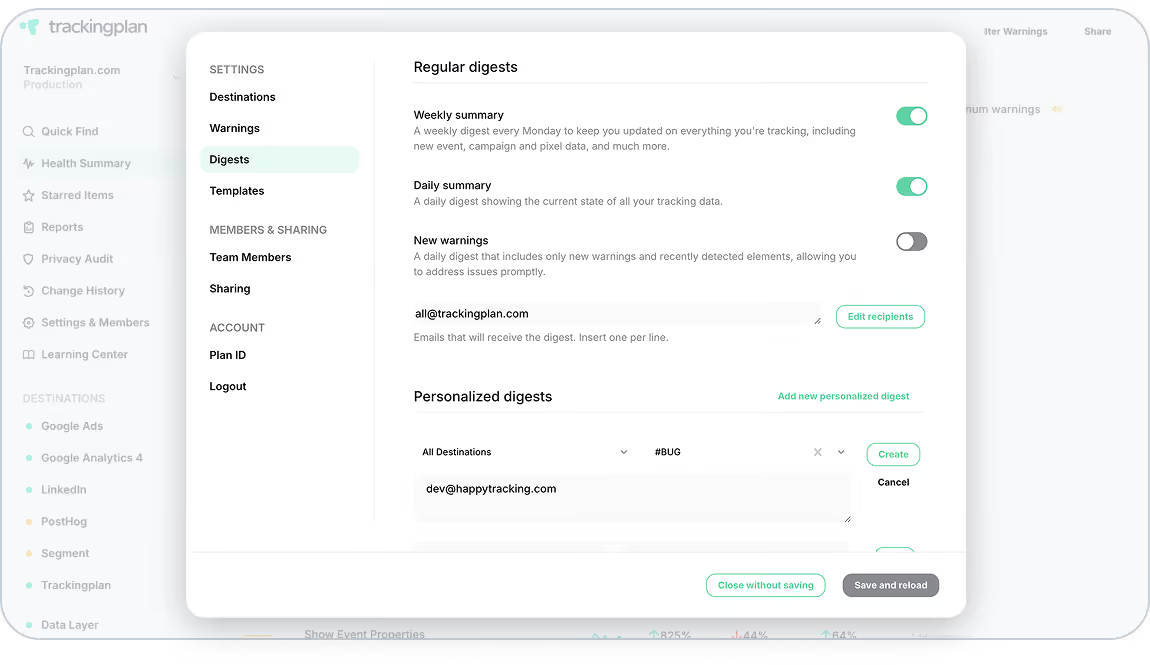
We’ve given Trackingplan’s Settings a fresh new look — with better organization, faster navigation, and a layout that’s easier on the eyes and your workflow.
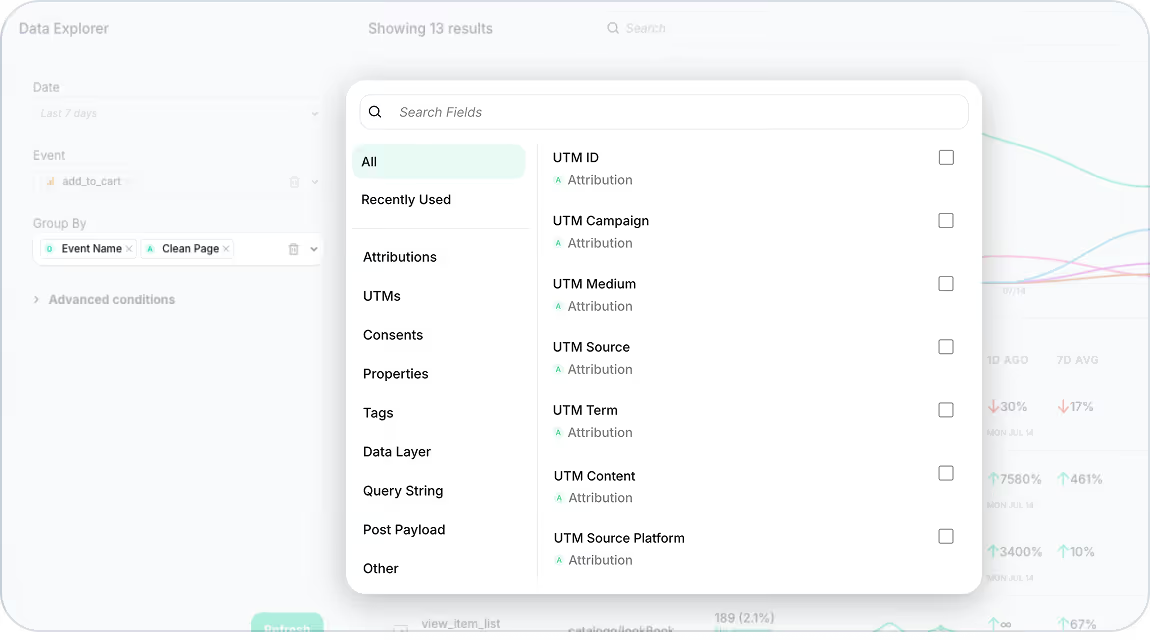
Explore and group your data faster with Trackingplan’s new Fields Selector. Personalize reports and debug issues with powerful new flexibility.
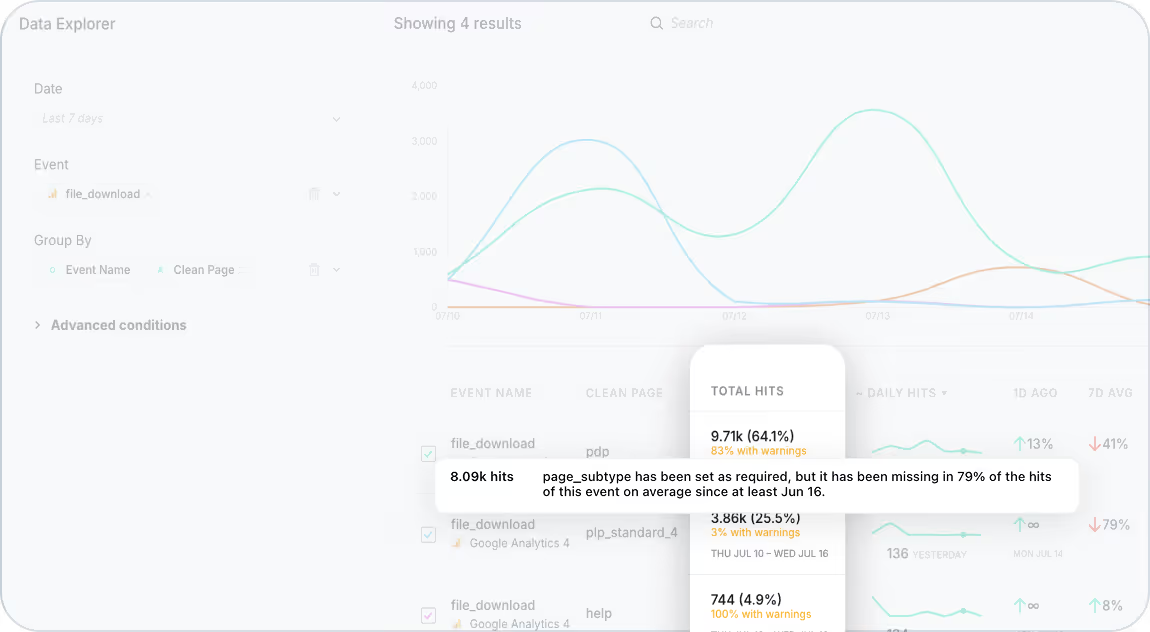
We’ve just made it easier to spot and investigate tracking issues — without ever leaving your analysis.
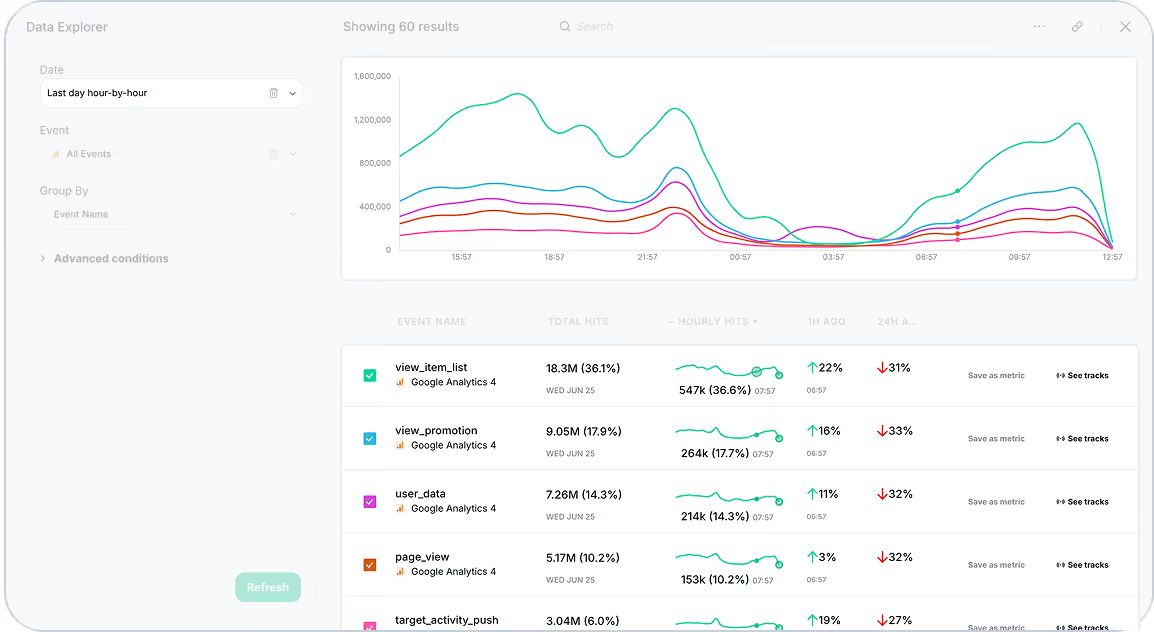
Get detailed, hour-by-hour traffic data for the last 24 hours in Trackingplan’s Data Explorer.
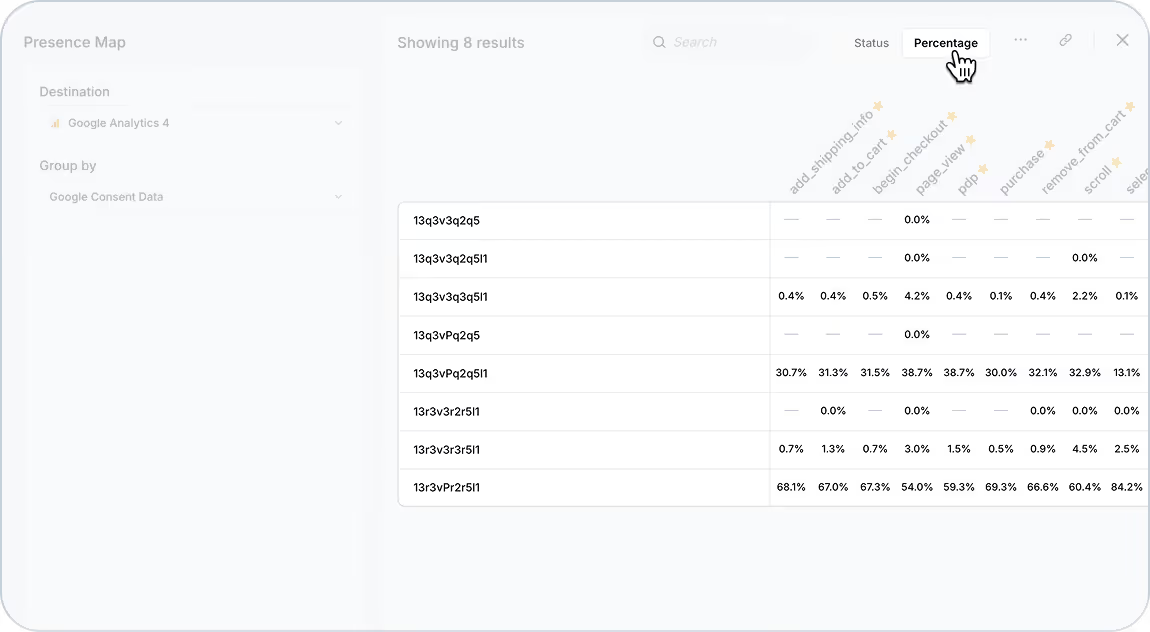
Trackingplan Presence Map now includes percentages to help you instantly understand where and how your events, pixels, consent settings, and DataLayer values are being tracked across platforms.
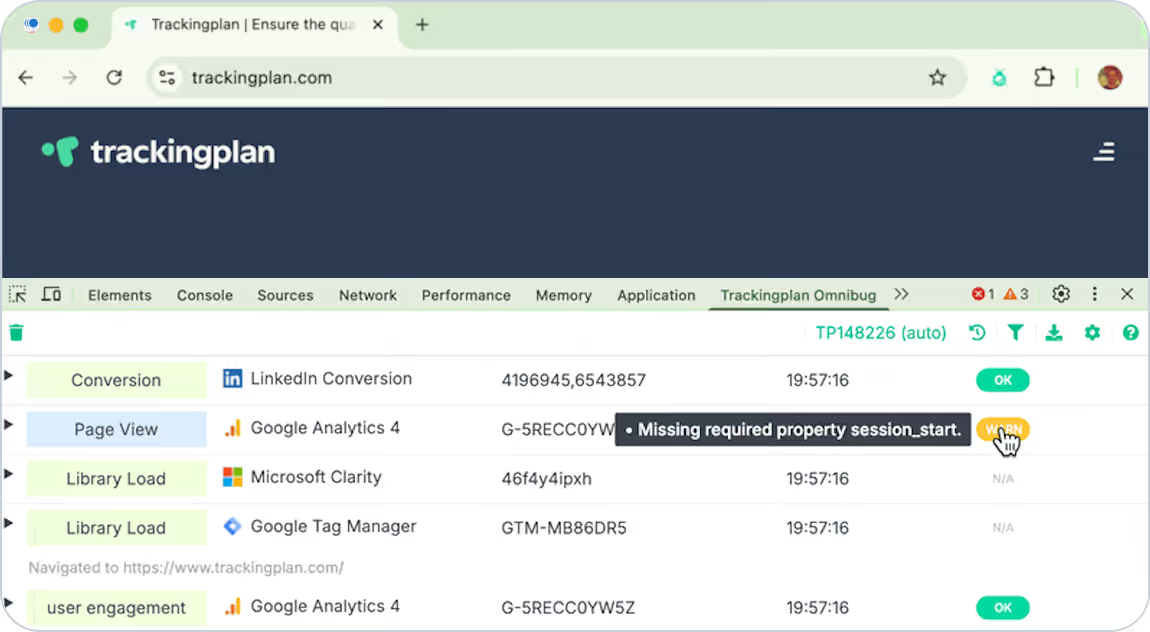
Validate your analytics in real time with the new Trackingplan Omnibug Extension. Instantly catch tracking issues, debug faster, and ensure spec compliance directly from your browser.
Track data quality in Looker Studio with Trackingplan's new connector. Monitor events, fix issues faster, and streamline analytics across all your plans.
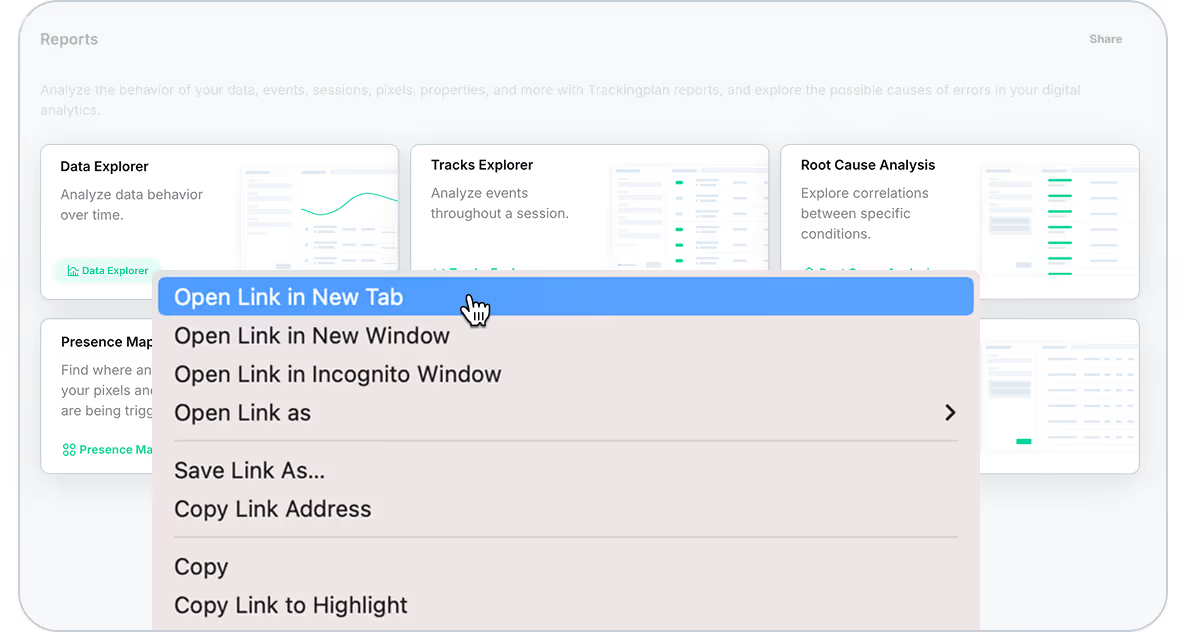
We’ve made it easier to deep-dive into your data without losing your place.
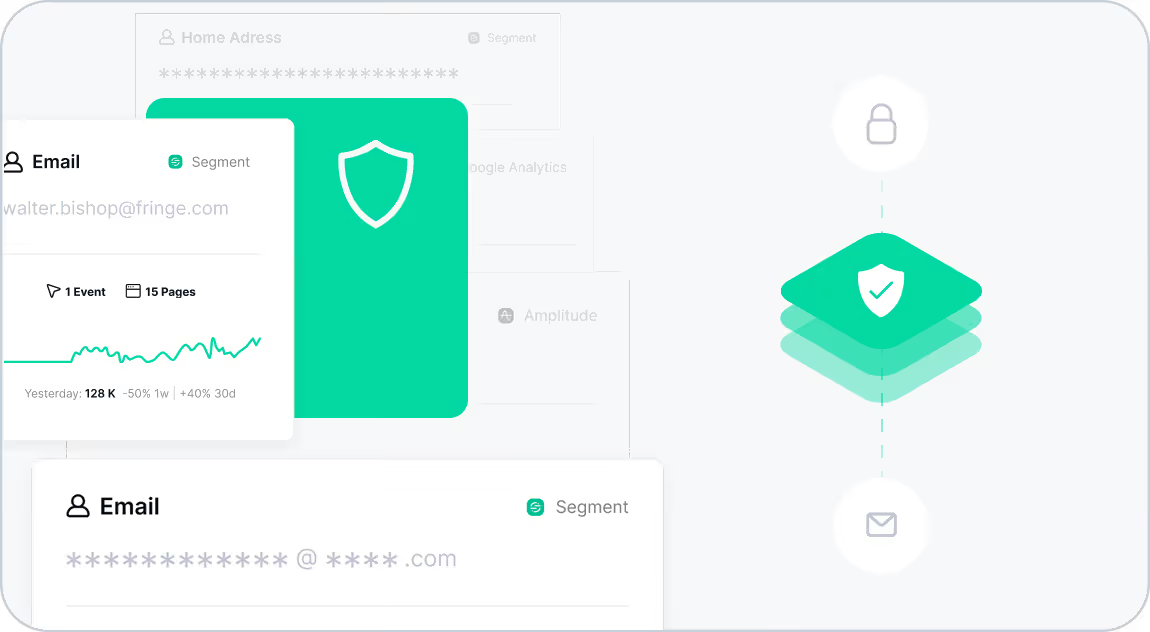
Automatically mask personal data at the source with Trackingplan’s enhanced Privacy SDK. Stay GDPR compliant by design while maintaining full visibility into your analytics.
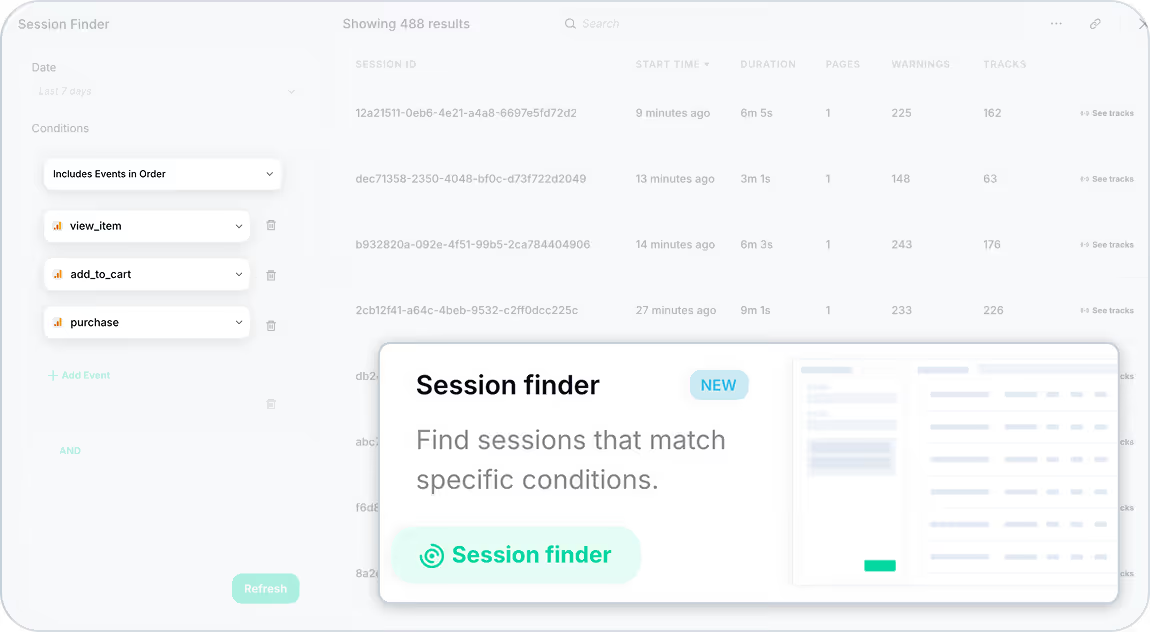
We’ve just released Trackingplan's Session Finder, a powerful new way to inspect and debug your tracking setup based on real user sessions — not simulated flows or synthetic data.
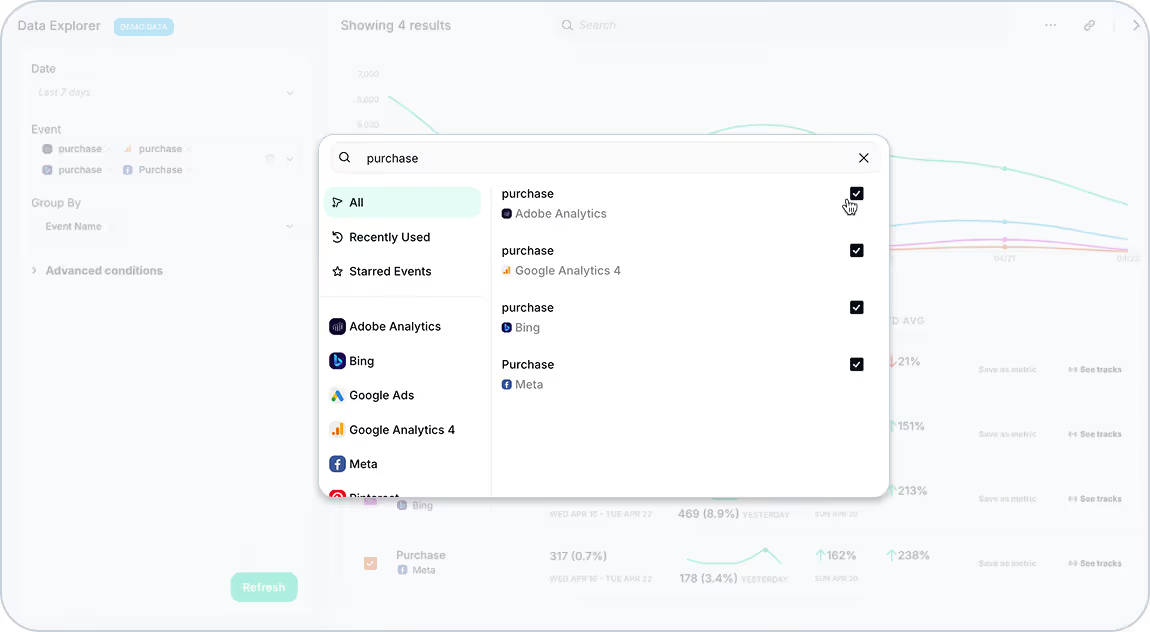
Compare events across all your platforms—faster, easier, and more powerful than ever.
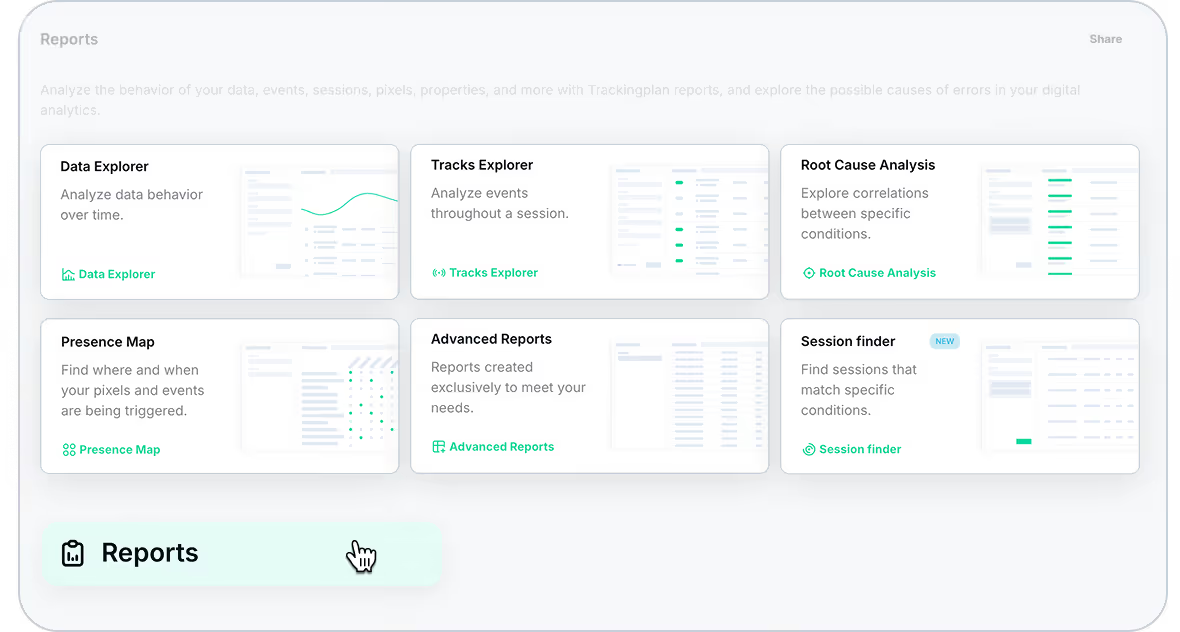
We’ve brought all your most powerful analytics reports together under one roof. Say hello to the new Reports page in Trackingplan — a centralized hub where you can explore your tracking data from every angle, all just one click away from your dashboard.
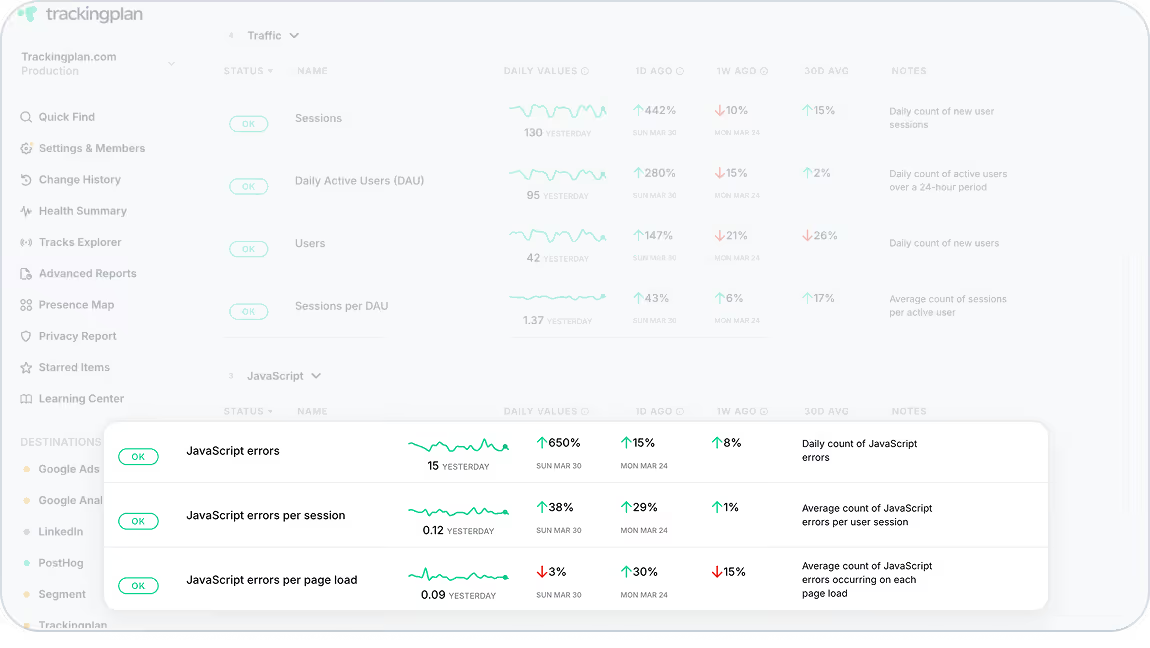
We've introduced JavaScript Errors Monitoring to help you detect and resolve JavaScript errors before they impact your site's performance and user experience.
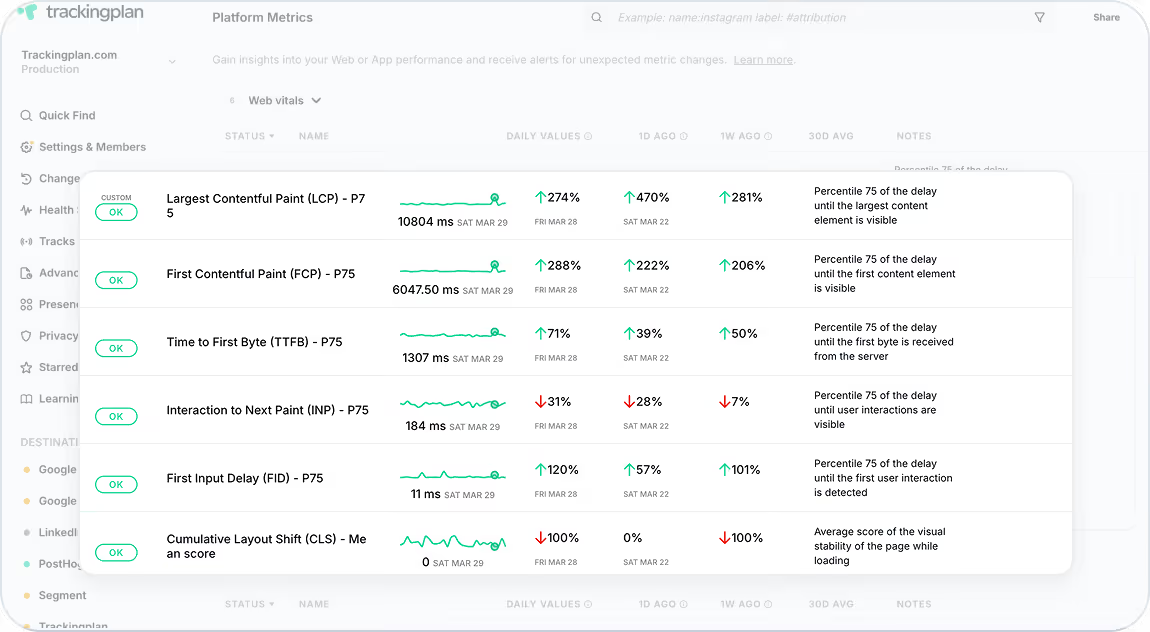
Trackingplan now automatically monitors Web Vitals, key performance metrics defined by Google, to help you optimize your website’s user experience, improve SEO rankings, and avoid wasted marketing spend.
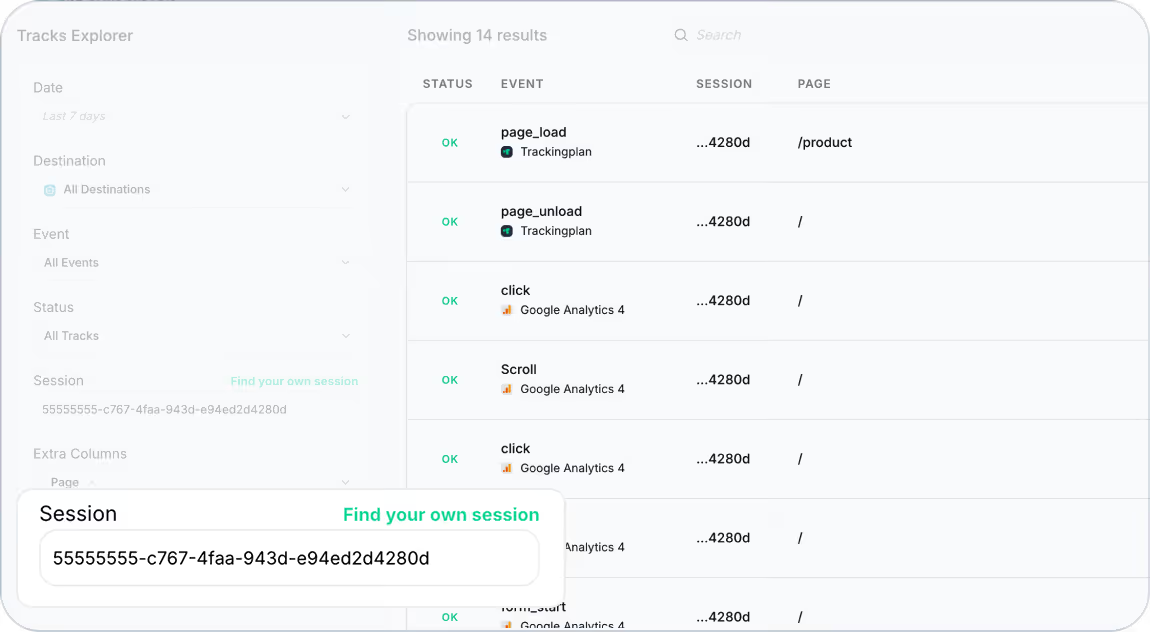
Now Trackingplan makes it super easy to isolate your session to track how each of your actions translate into hits in real time.
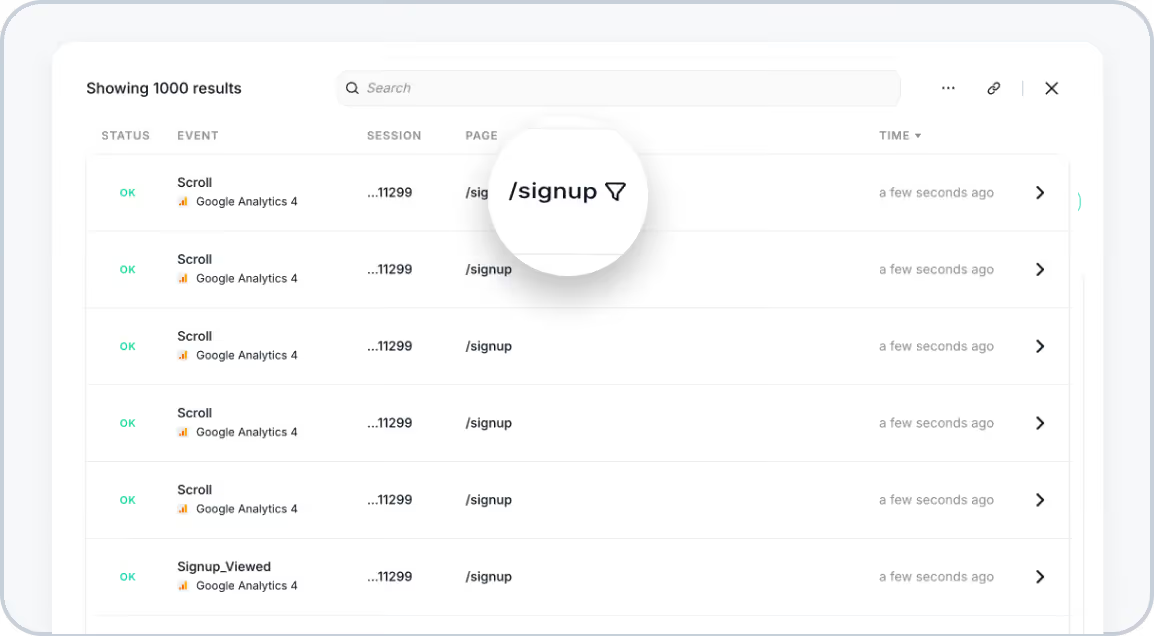
Instantly filter and refine your searches within the Tracks and Data Explorer views with just a click—no more manually entering conditions.
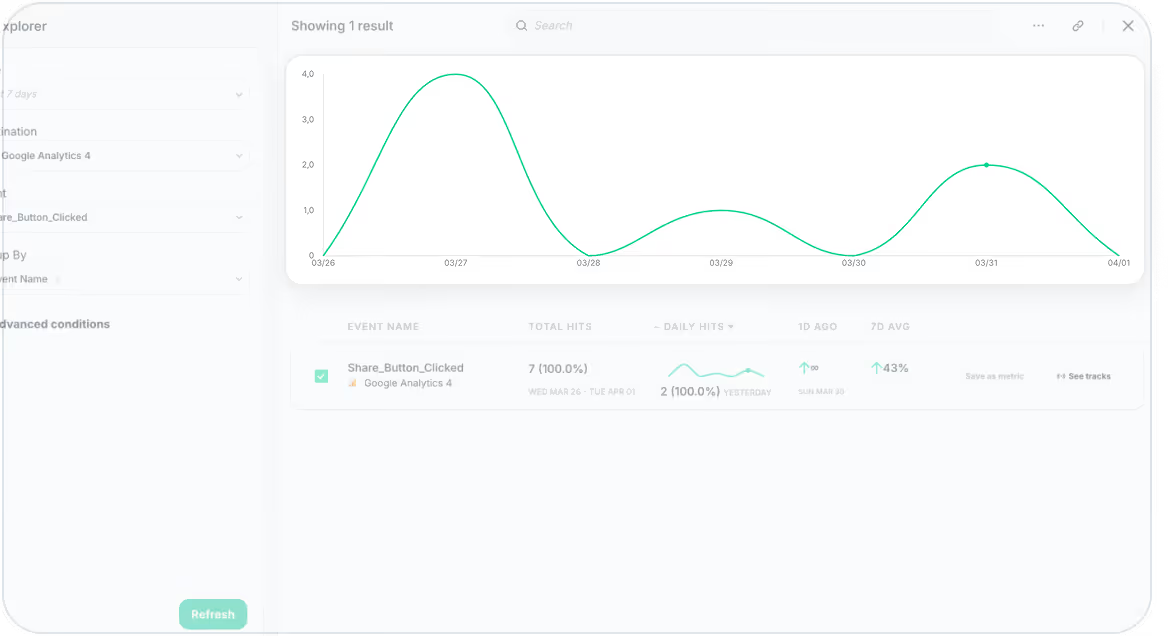
Trackingplan’s Data Explorer now includes interactive graphs for better data visualization! Explore traffic trends, compare event hits, and customize your analysis effortlessly.
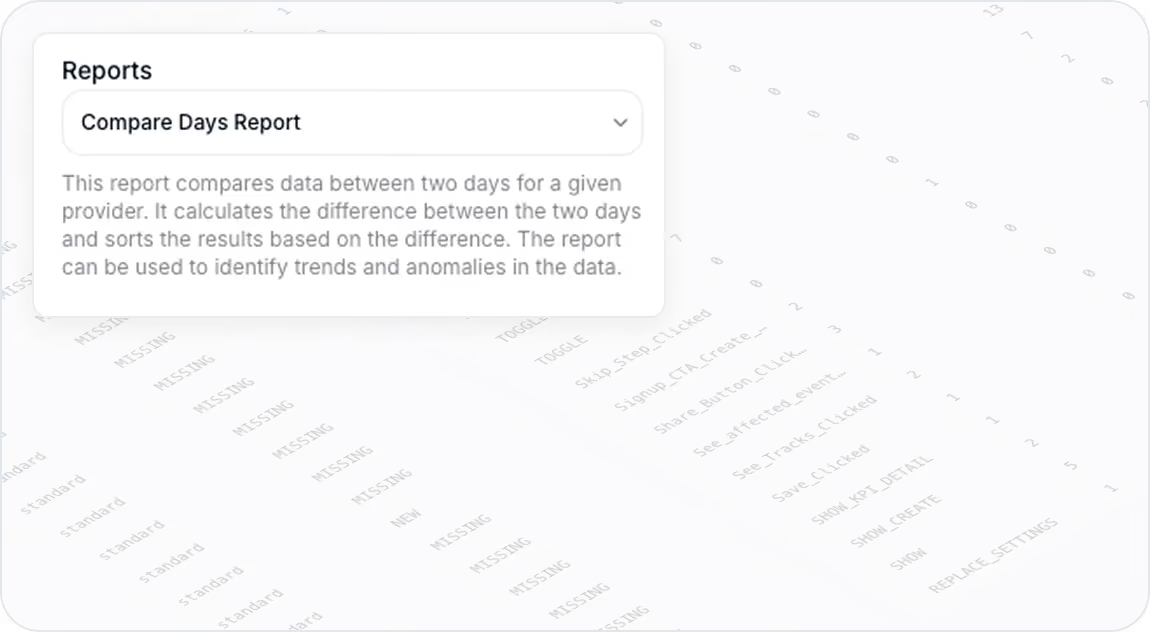
Trackingplan’s Advanced Reports provide you with powerful tools to monitor, analyze, and compare your data more effectively. Designed to streamline your analytics workflow, these reports help you uncover insights that can improve tracking accuracy, detect discrepancies, and optimize your data-driven decisions.
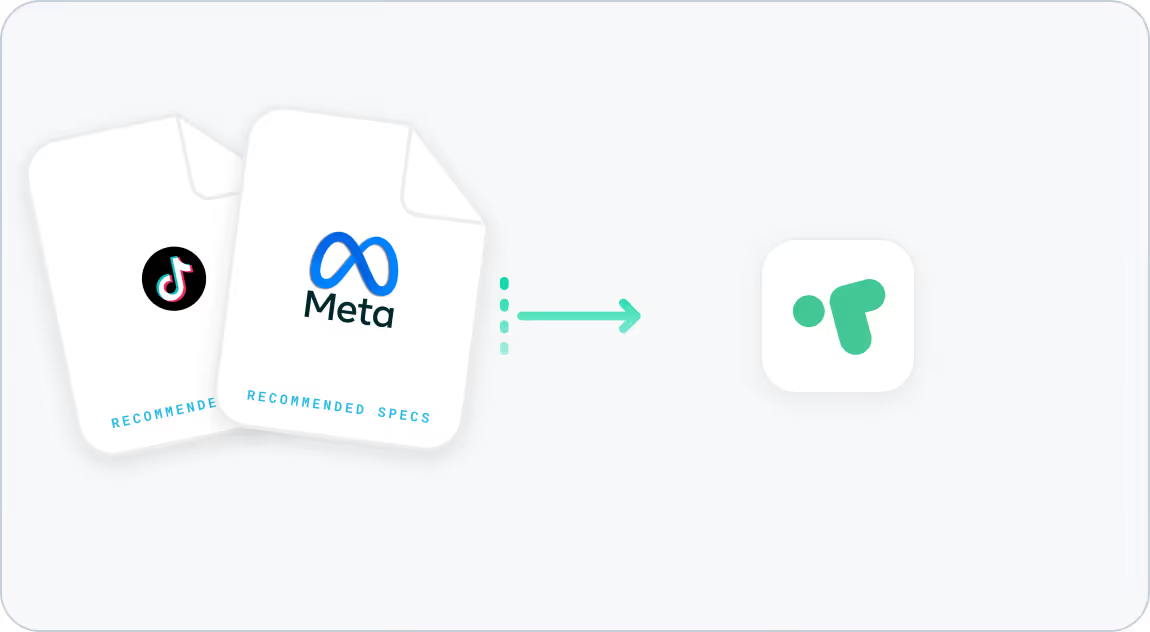
Trackingplan automatically applies event and property specifications based on the recommendations from your Analytics and Marketing tools, providing early specification warnings to help you quickly correct discrepancies and maintain high data quality standards.
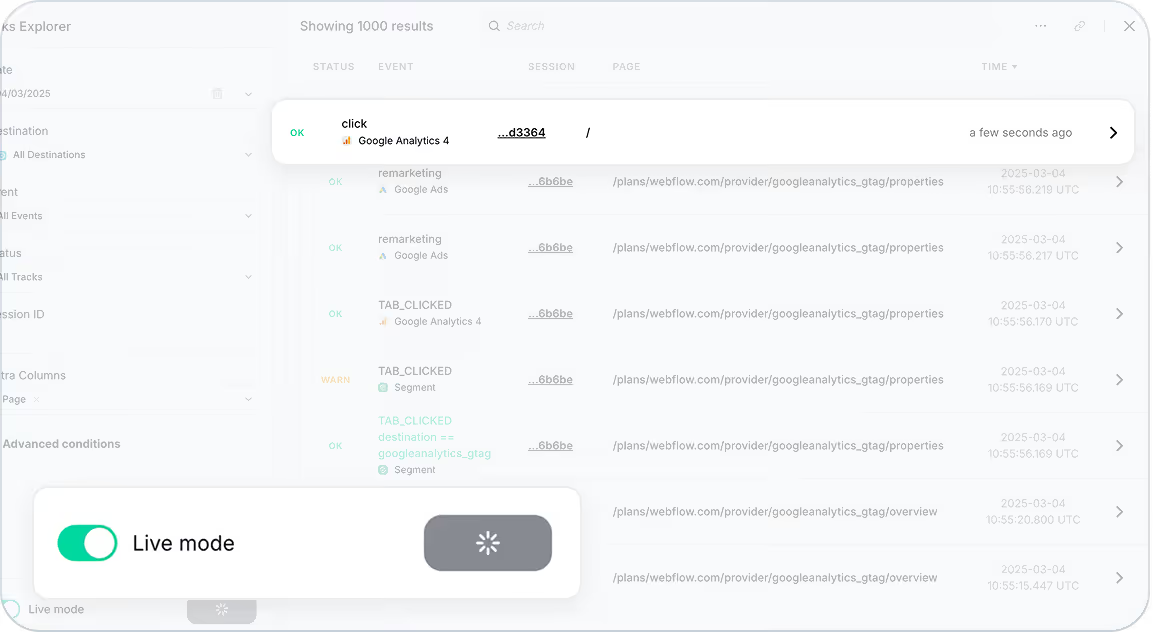
Trackingplan now lets you see hits arriving on your website and apps in real-time! Instantly validate hits as they arrive on your website and apps for accurate insights.
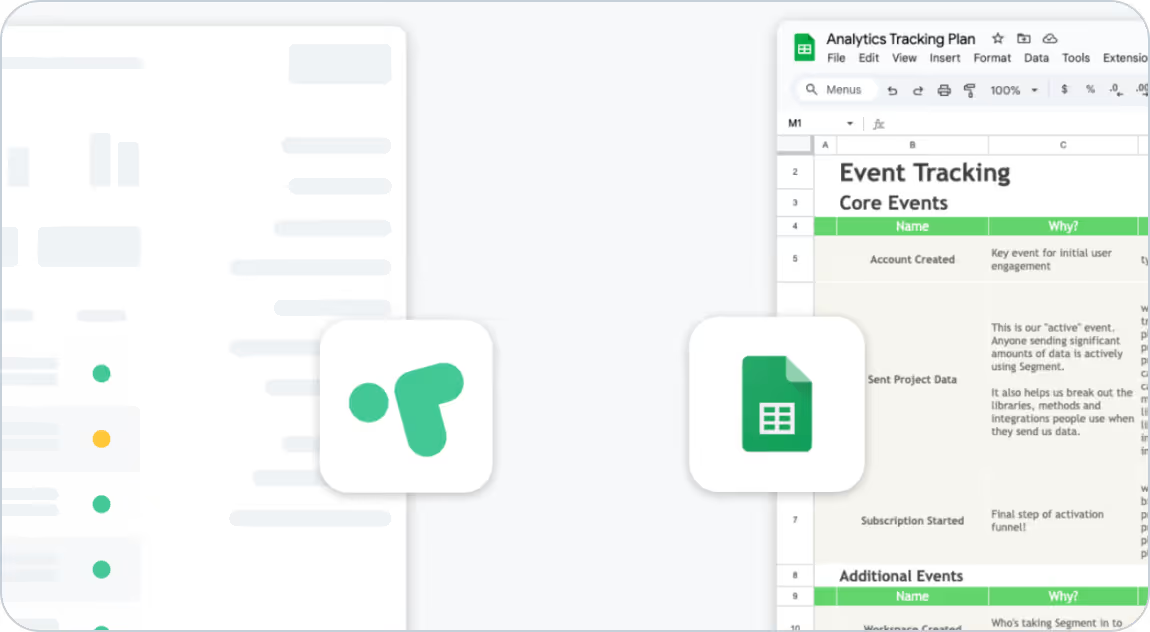
Maintaining accurate tracking plans shouldn’t be a full-time job. With Trackingplan’s App for Google Sheets, you can automate the entire process—eliminating manual updates, preventing data discrepancies, and ensuring your analytics stay accurate and up to date.
.avif)
Now, analyzing event trends is easier than ever! With our new date selector, you can view total event hits over the last 14 days with a clear timeline and filter sessions by a specific date in your Tracks Explorer.
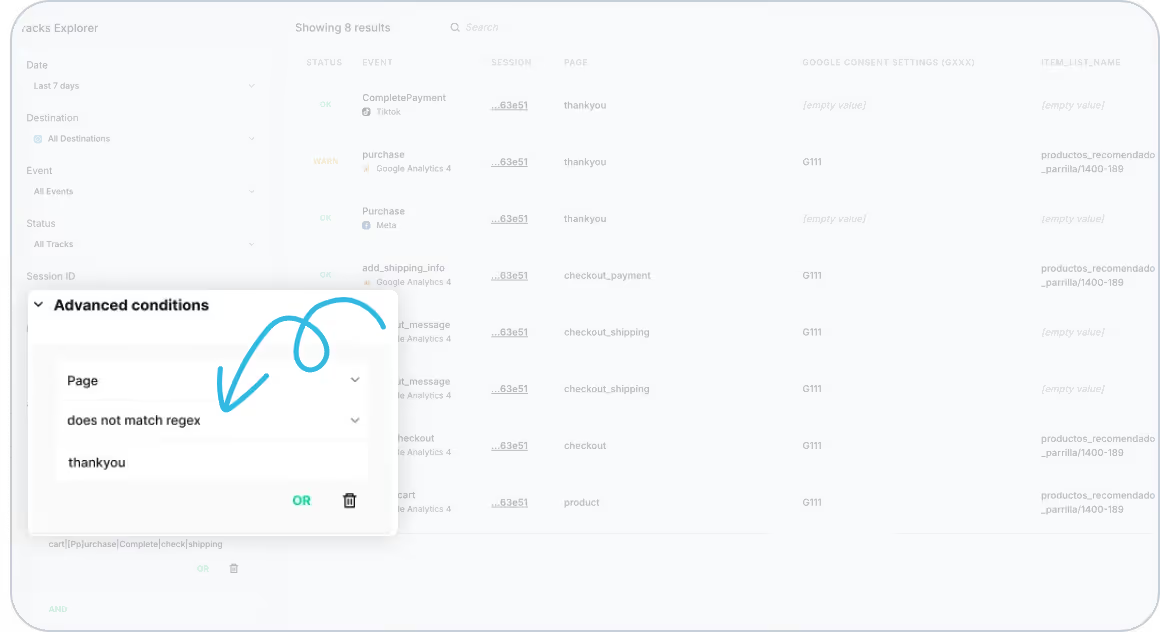
Easily isolate issues by excluding unrelated events from cluttering your view, focus on what matters, and detect inconsistencies faster.
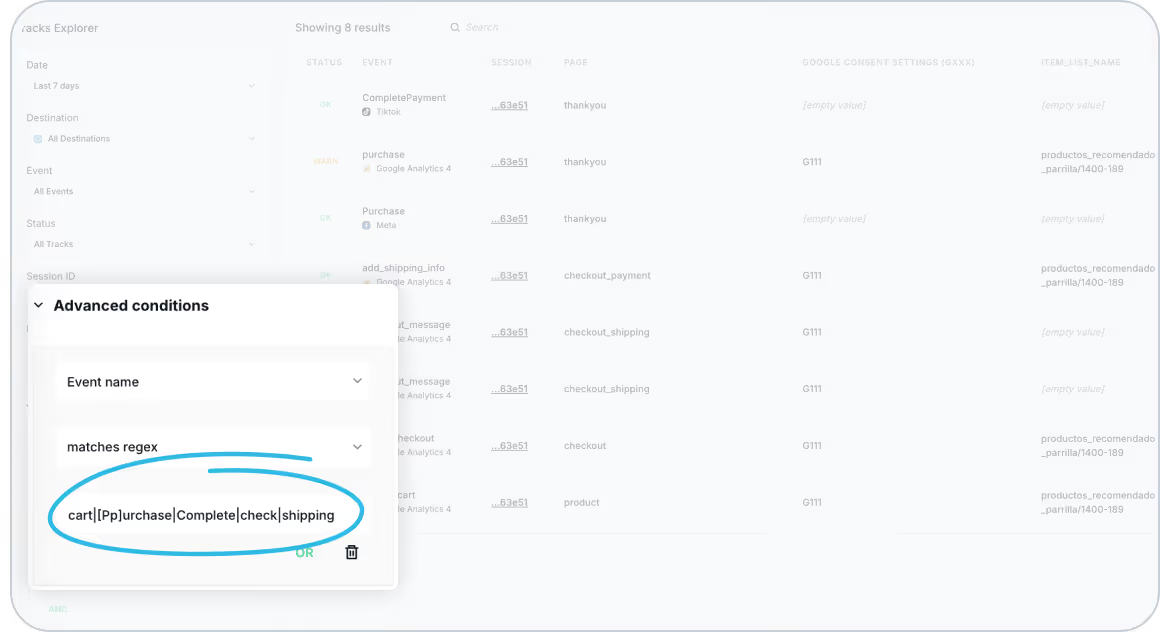
Now, with Advanced Conditions, you can filter your search to view multiple events across different providers at once.
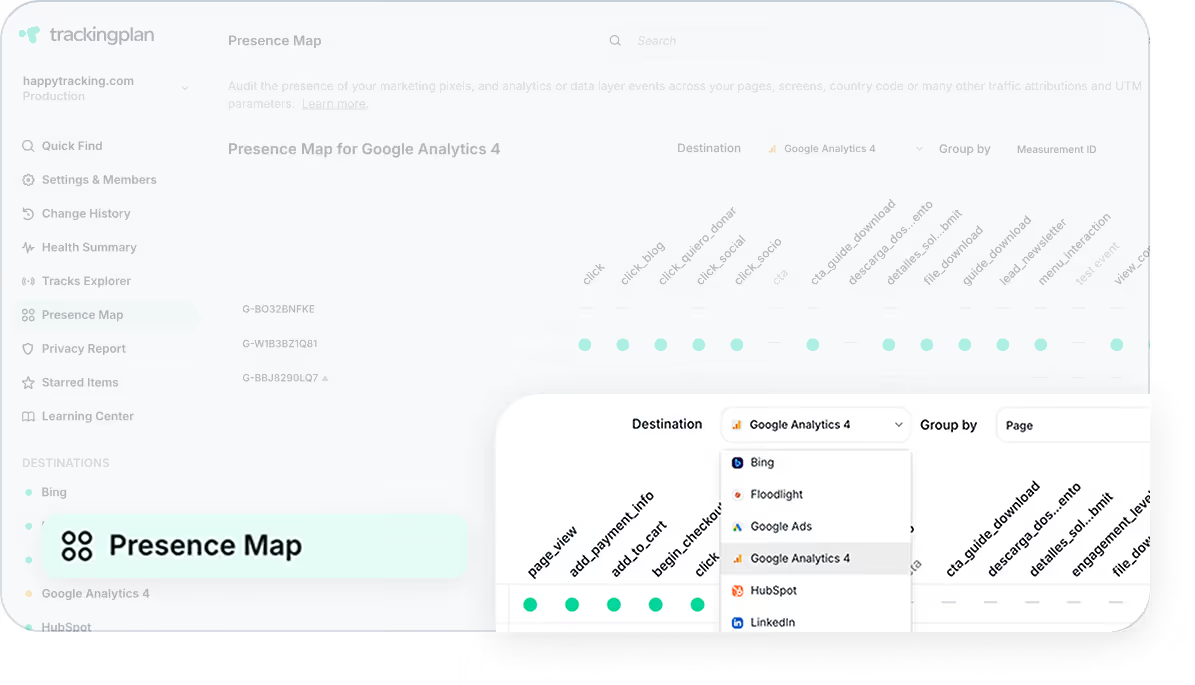
Trackingplan's Presence Map provides a clear, visual interface to help you ensure that all your events, pixels, and Data Layer values are consistently tracked across pages, UTMs, consent settings, and key attributions.
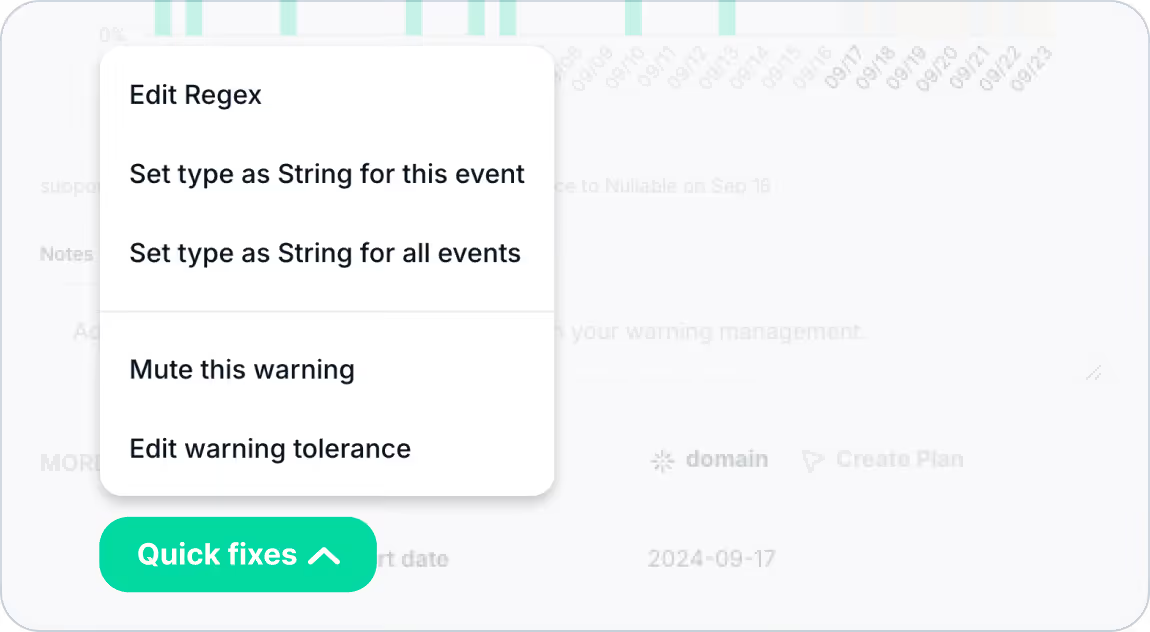
With Warning Quick Fixes, managing your tracking setup has never been this effortless. Take control of your warnings, streamline your workflow, and ensure data quality—all in just a few clicks.
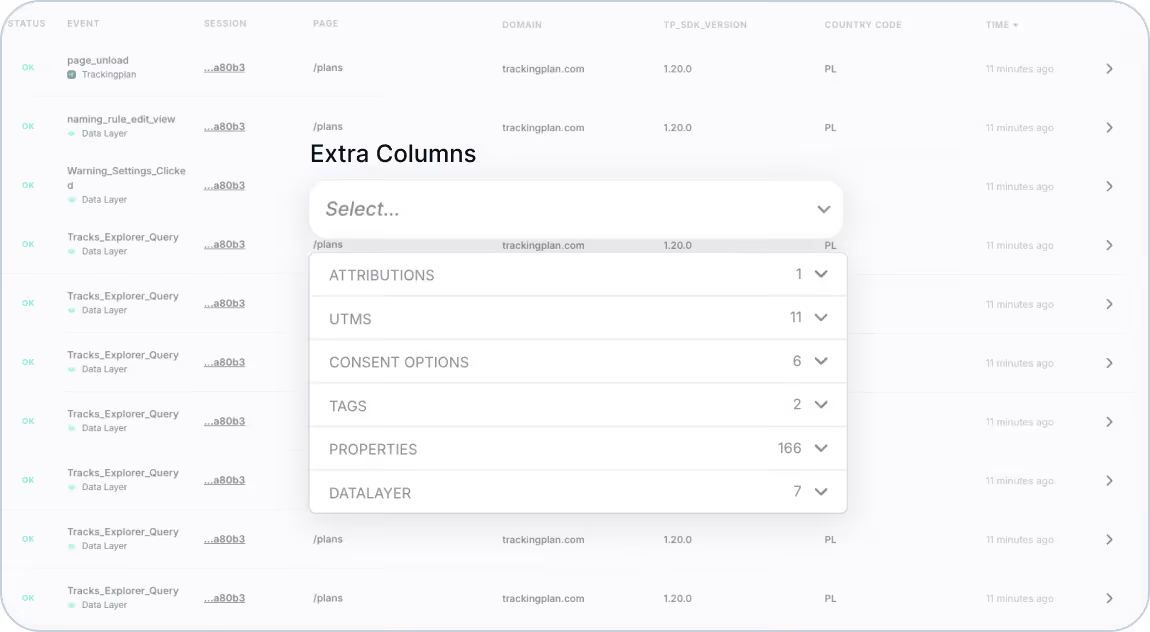
Now you can tailor your Tracks Explorer view by adding extra columns to display the data that matters most to you.
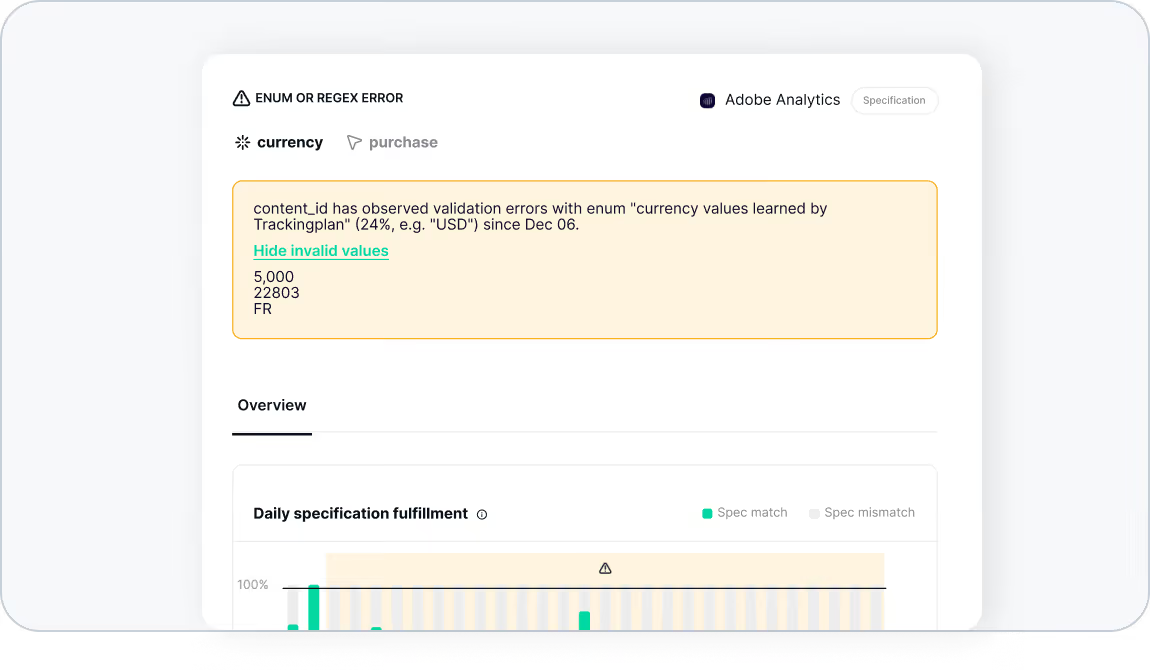
For Enum or RegEx errors, now you can simply click on “Show more invalid values” to easily identify problematic values and resolve conflicts more efficiently.
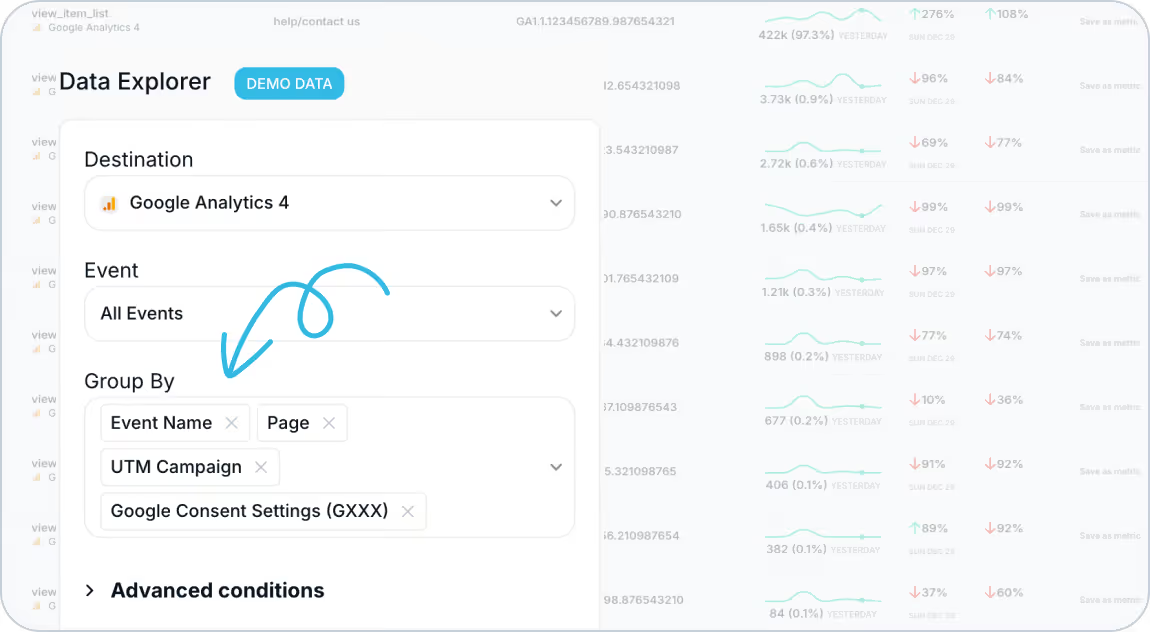
Now you can personalize your Data Explorer view by grouping your data by any of your attributions, UTMs, Consent Options, and DataLayer values.
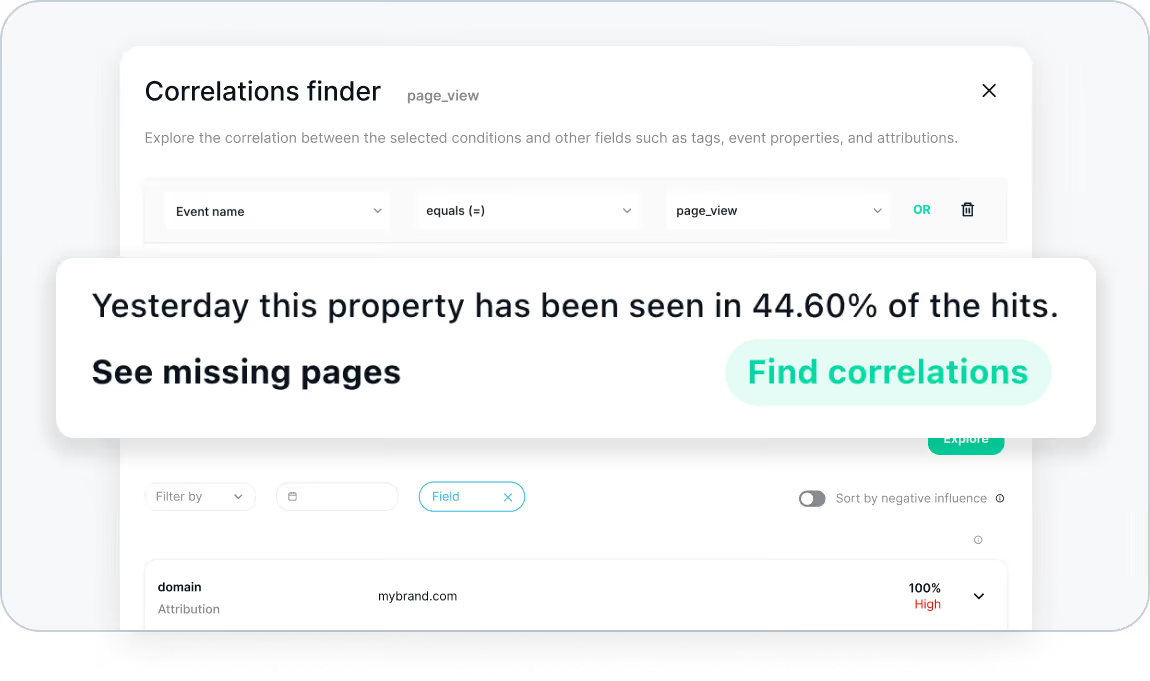
Now you can go to any property that isn’t complete, even if it’s optional, to easily understand why it is not arriving 100% of the time.
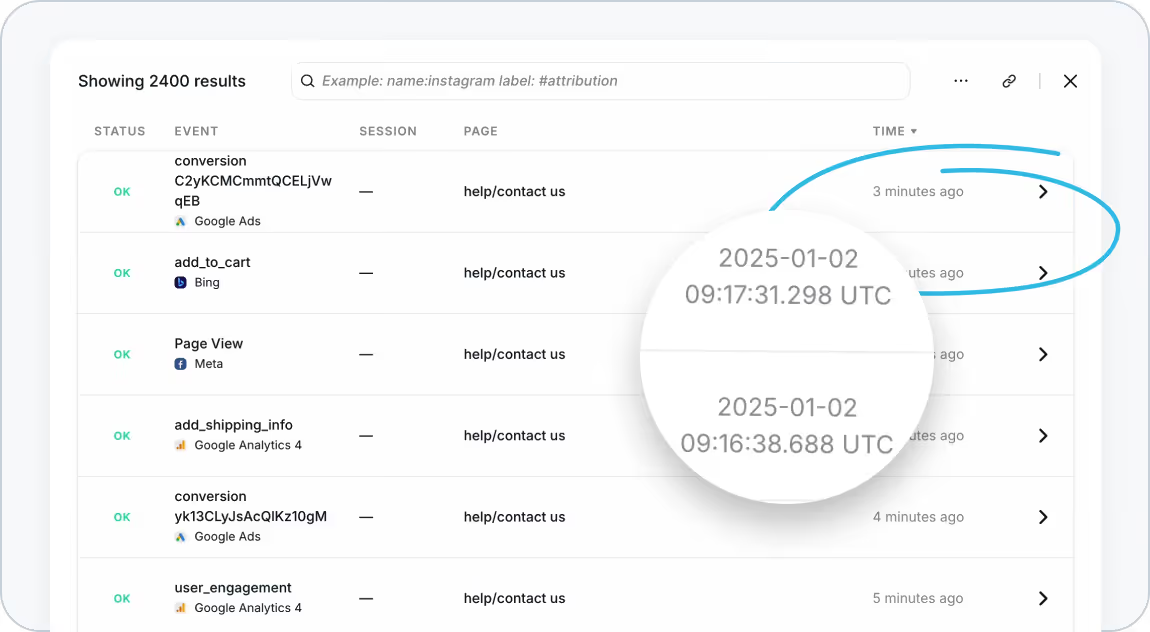
We’ve added timestamps within sessions to help you identify if events are being duplicated or captured simultaneously, giving you a clearer picture of your data!
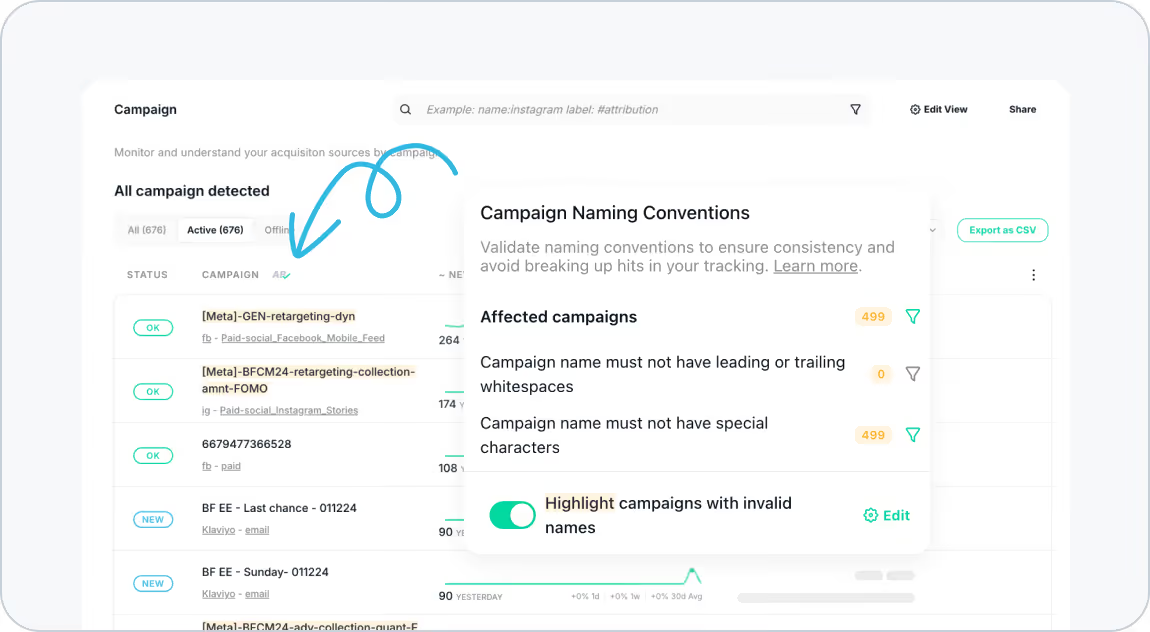
Ensure consistent and accurate data with Trackingplan's naming convention rules for your UTMs and analytics implementations.
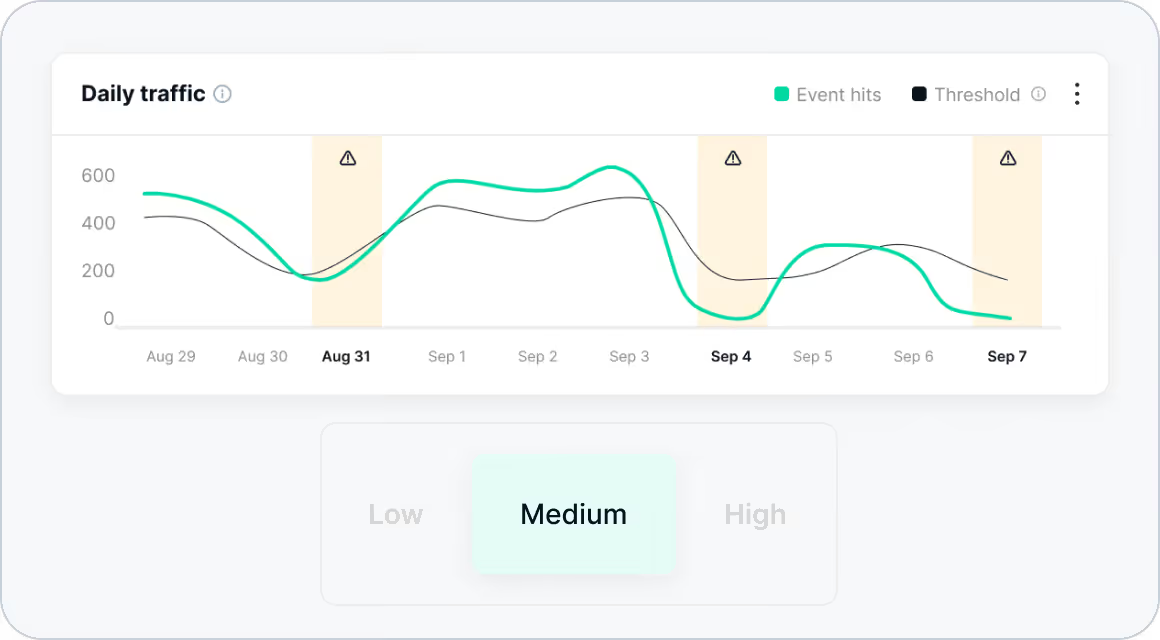
Now Trackingplan provides customizable traffic warning tolerances for Traffic Drops and Traffic Peaks.
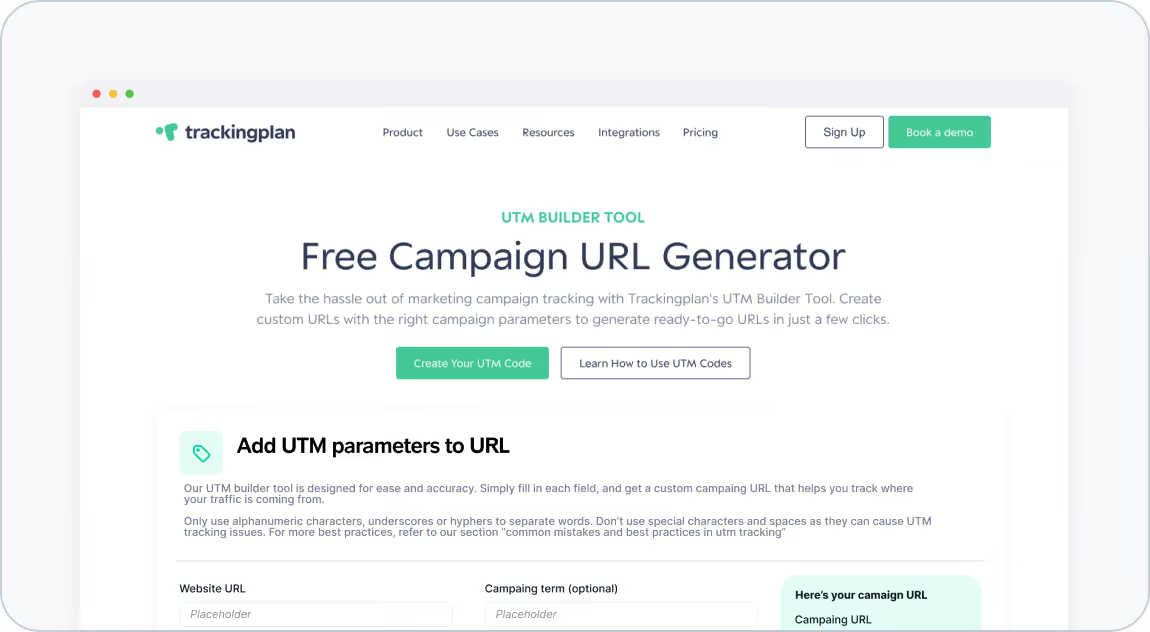
Creating perfect campaign URLs is now simpler than ever with Trackingplan’s UTM Builder Tool.
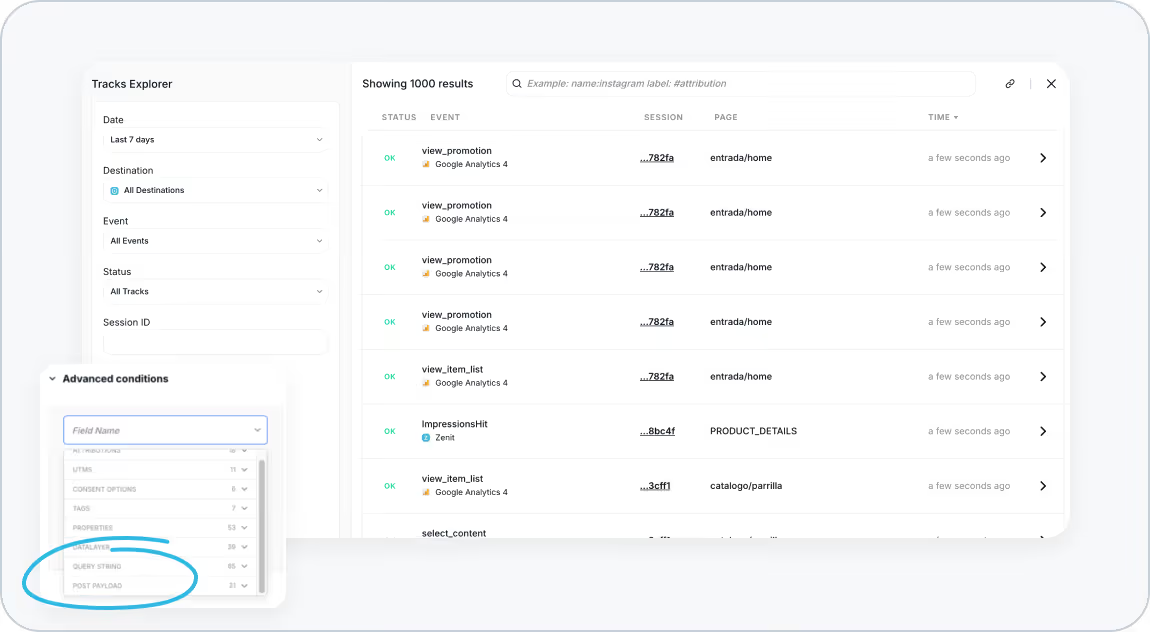
You can now filter by query string and post payload in both Tracks Explorer and Data Explorer. Search for specific query string values and payload parameters and dive into the details of what’s processed and reported to investigate issues faster!
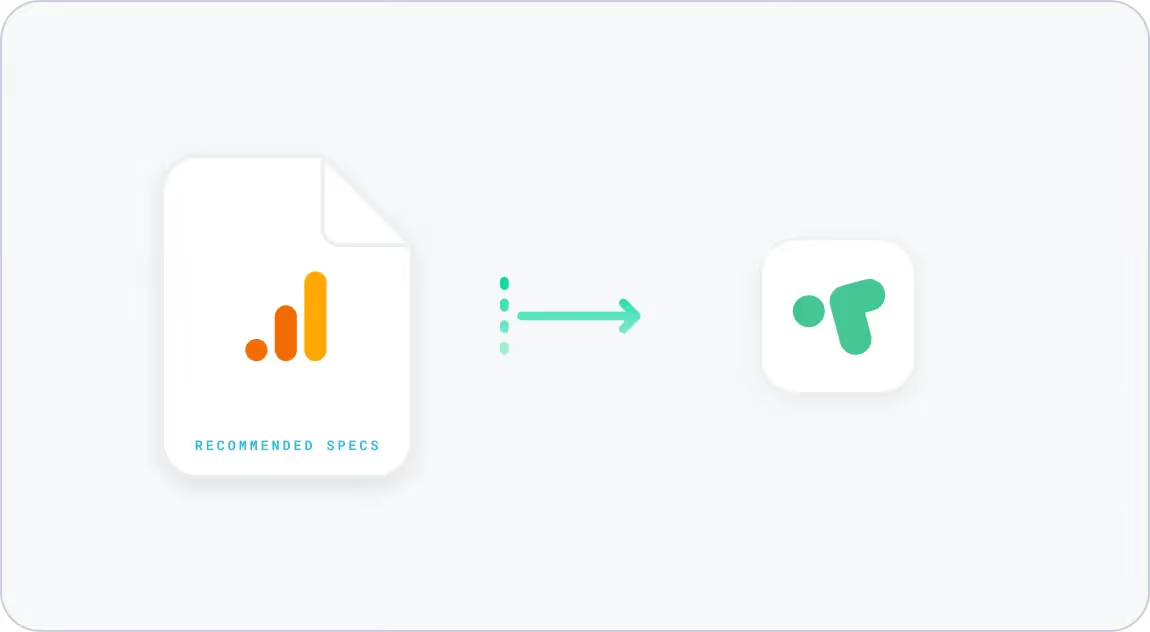
Trackingplan now automatically applies event and property specifications based on the recommendations from your Analytics and Marketing tools.
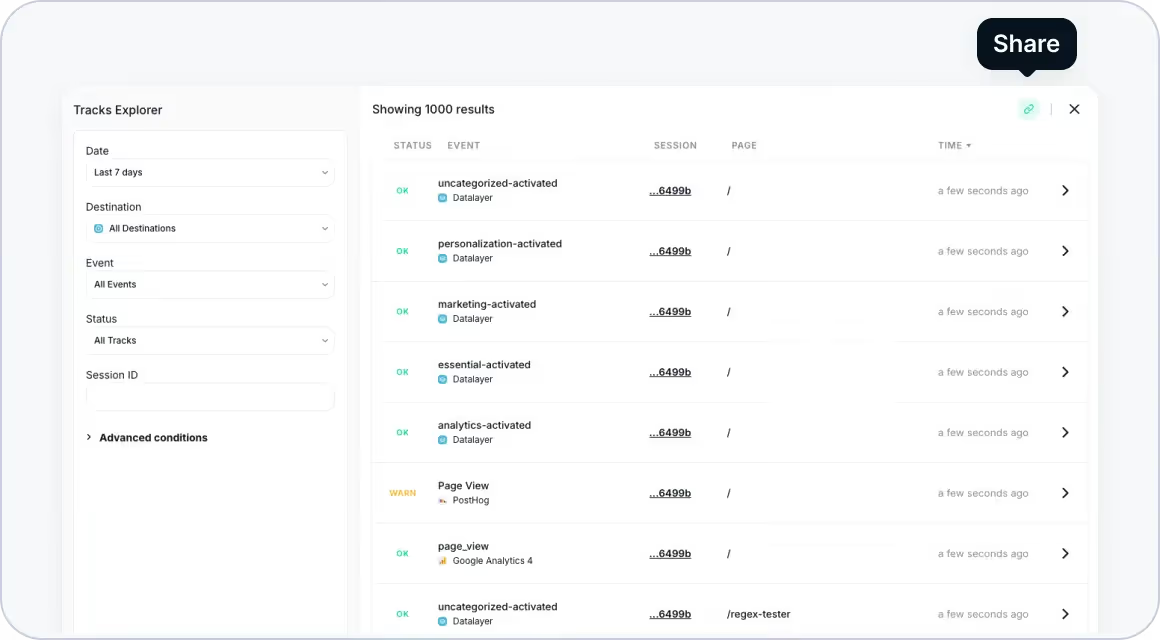
Sharing specific insights just got a whole lot easier! Now sharing precise views in your Data Explorer, Tracks Explorer, or the Track Sidebar is all just one click away.
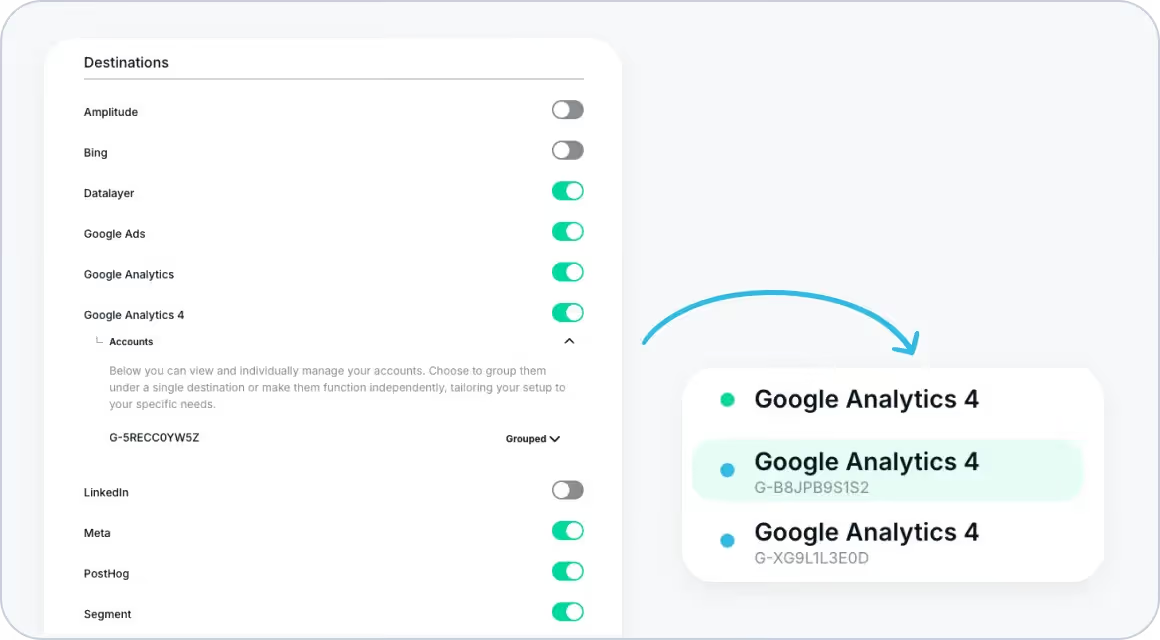
Now you can split the traffic of your destinations by account ID, allowing you to view traffic from each ID separately as a new destination, or even exclude specific account IDs from any processing to prevent traffic from reaching your dashboard.
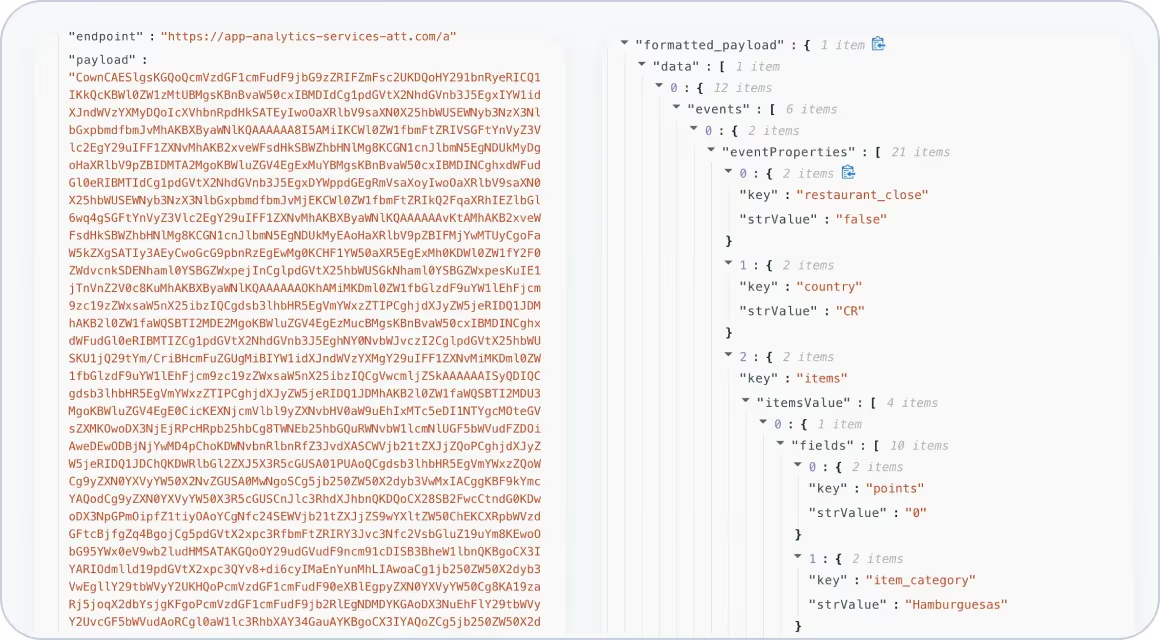
Now you can view a clear and easy-to-read version of iOS Firebase data, allowing you to see all the important details of each track without confusion.
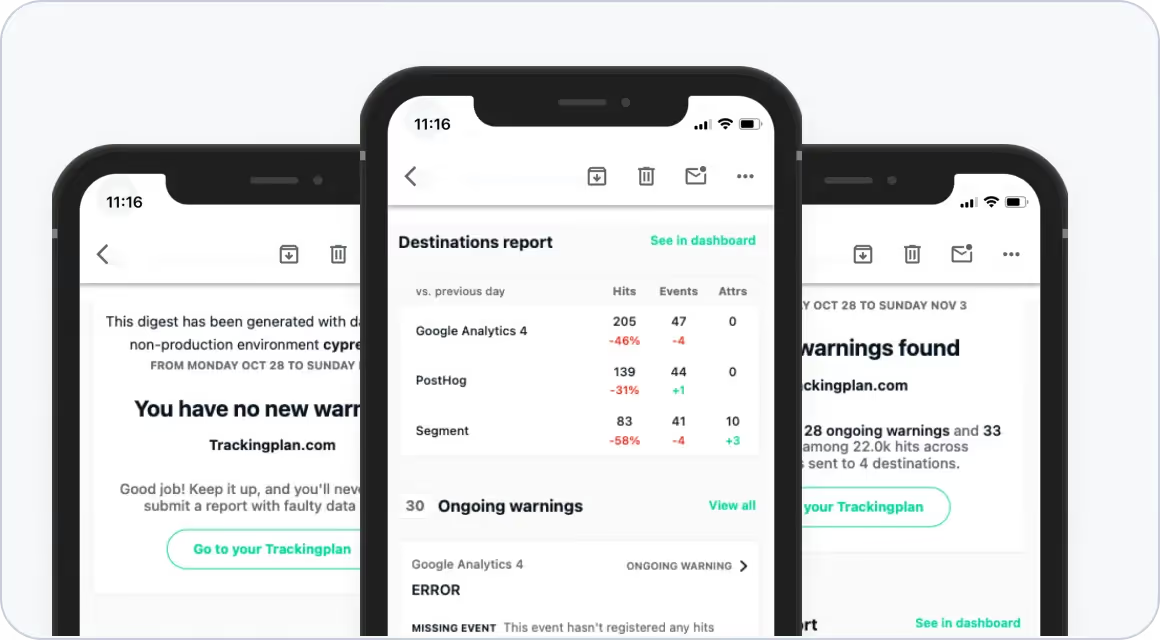
We’ve added new digest variants, with flexible summaries tailored to your tracking needs!
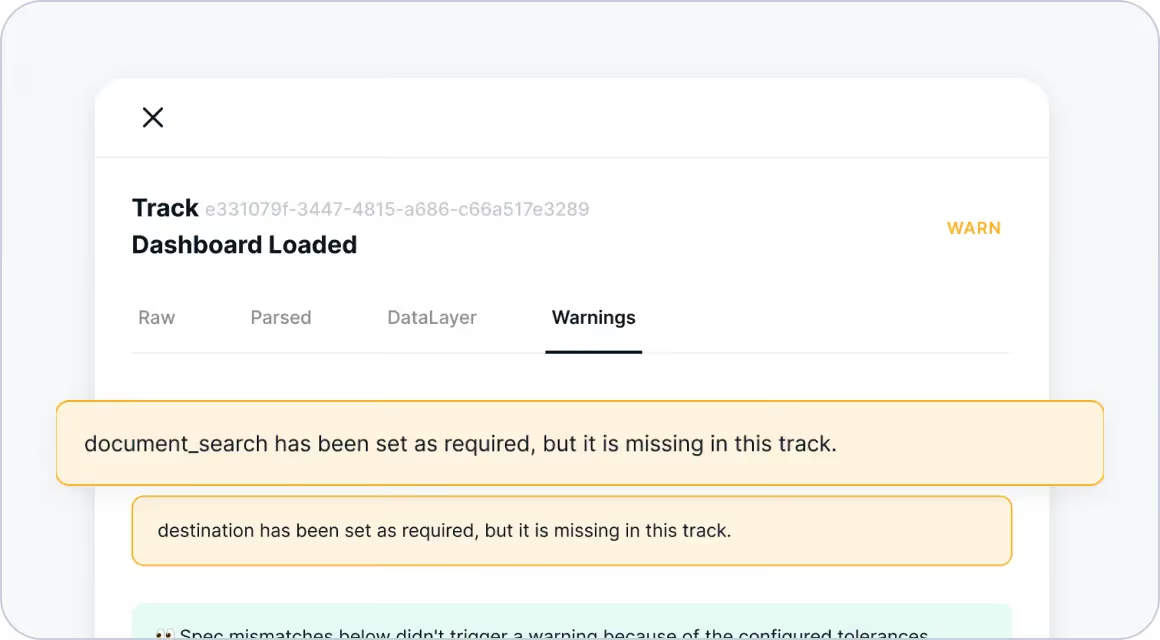
We’ve enhanced our Tracks Explorer, adding more information about the warnings found in each of your tracks.
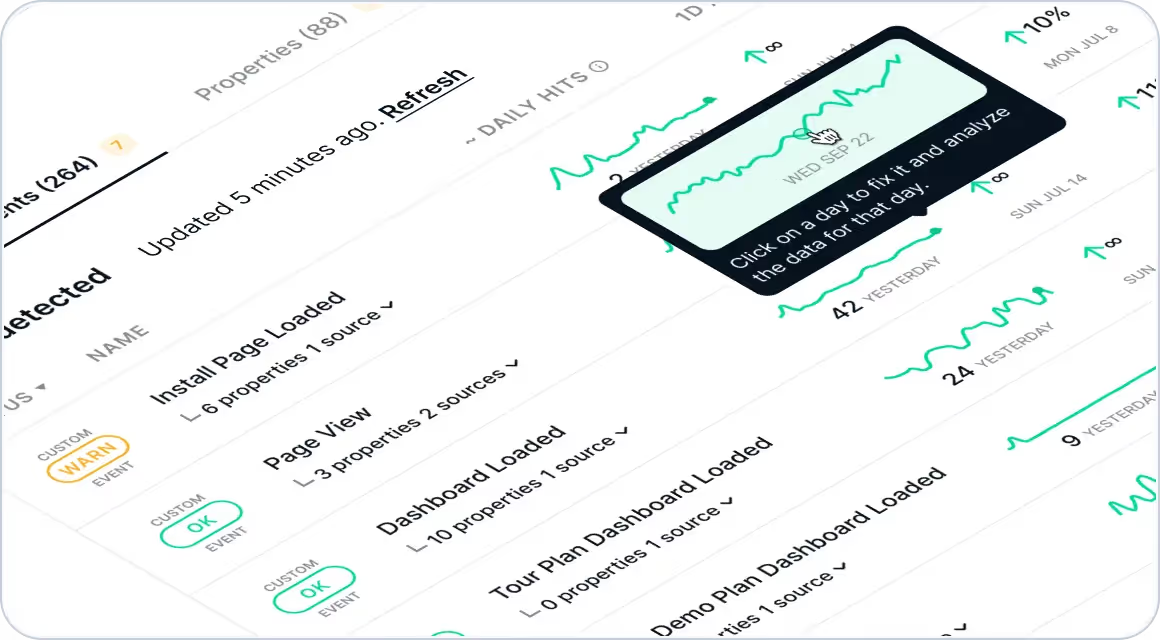
For all your destination and acquisition pages, now you can refresh your data every 5 minutes to obtain the most recent data available at that moment, making it highly effective for real-time monitoring and staying up-to-date as new data flows in.
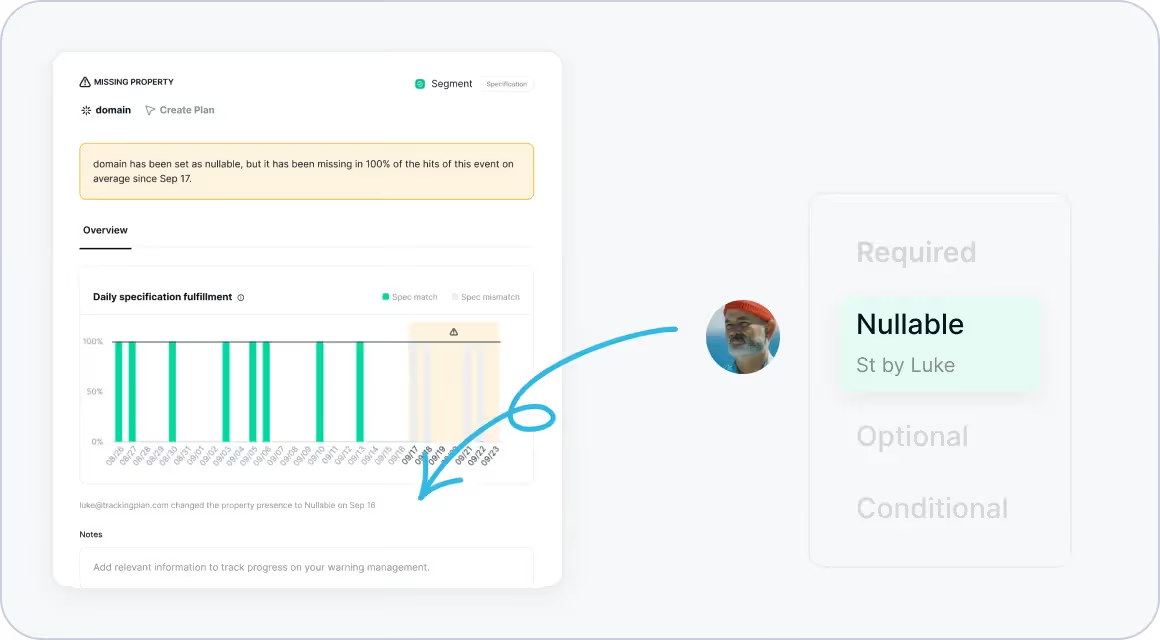
In your Warning Management View, now you’ll be able to see who edited your specs. Stay on top of changes and keep your team in sync with just a glance!
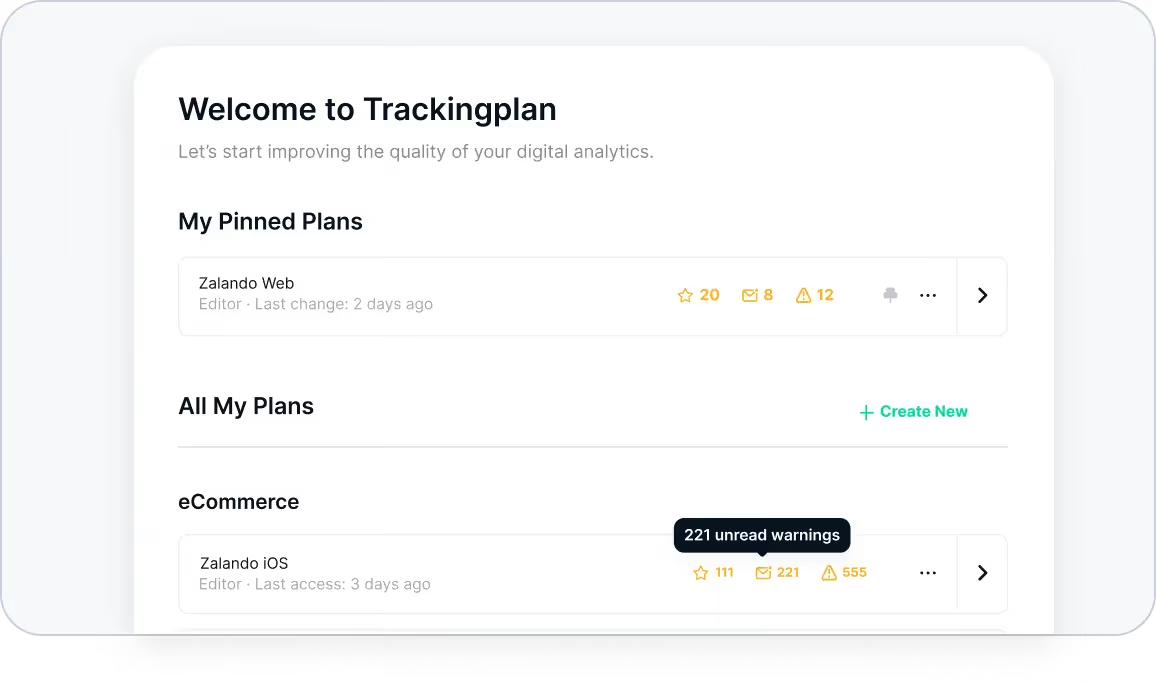
We’re excited to introduce our new Plans Overview, a powerful new view designed to give you more control and visibility over all your plans.
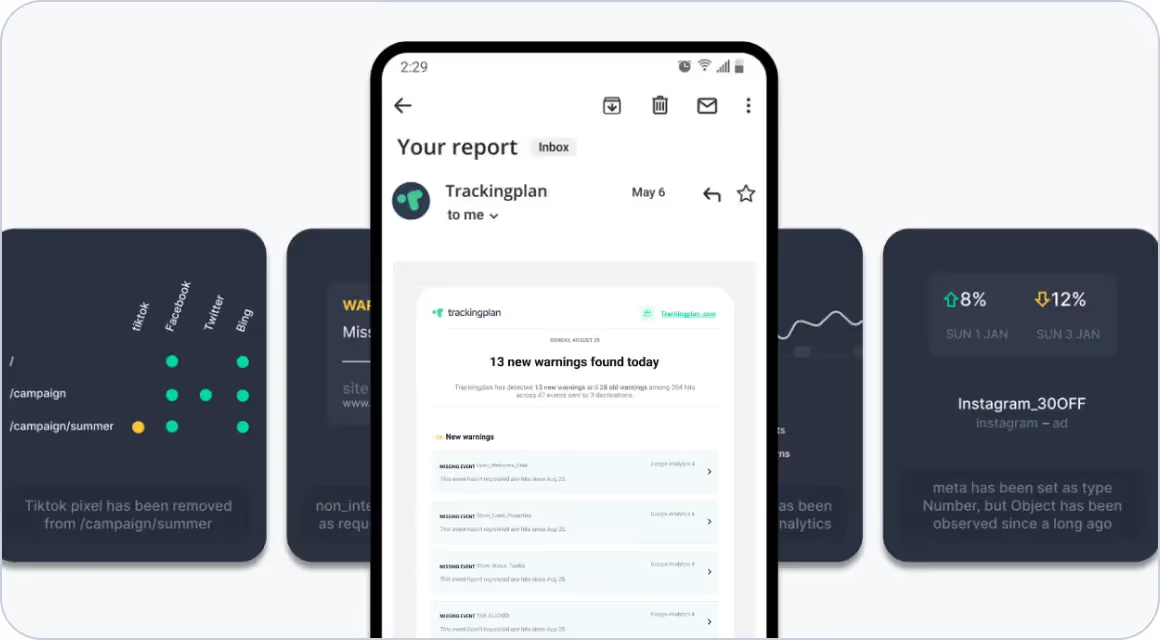
We're excited to present you a significant update to Trackingplan's Daily Digest.
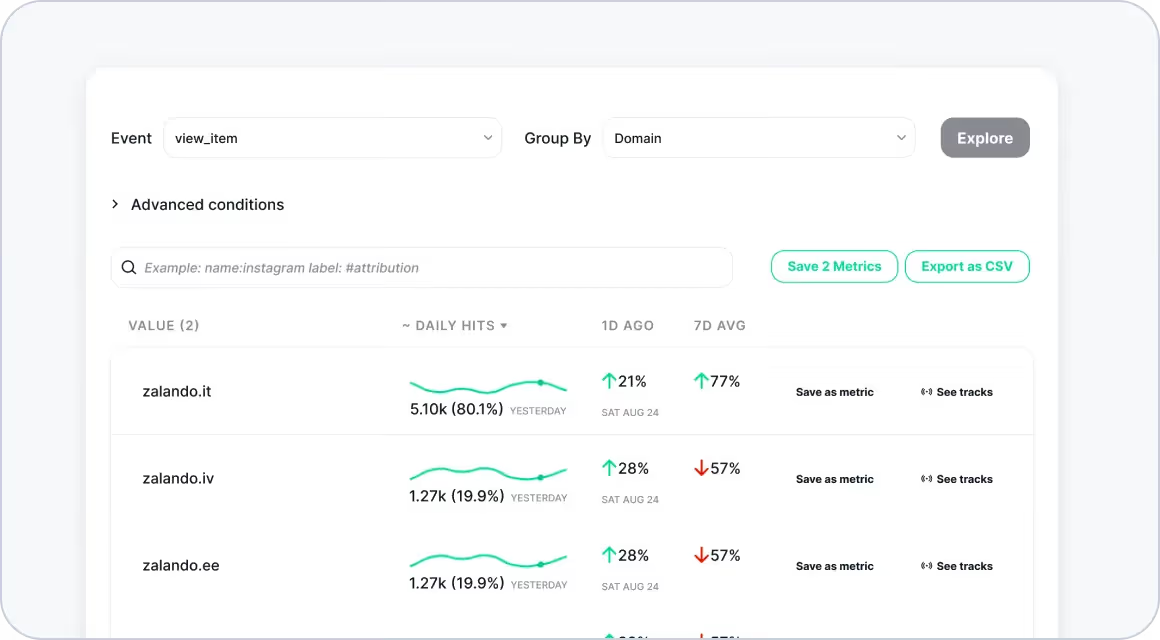
We’ve added Domain Attributions to simplify the process of filtering and debugging your analytics data on a per-domain basis.
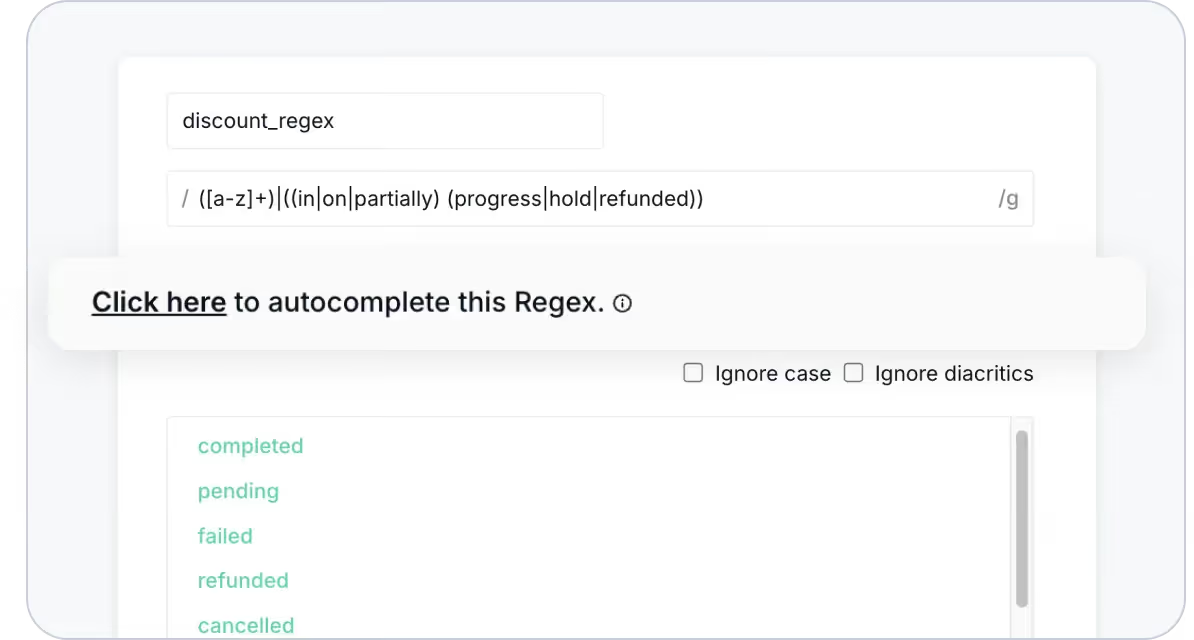
We now offer the ability to automatically generate regex patterns, allowing users to create precise and robust validations without needing to write complex patterns manually!
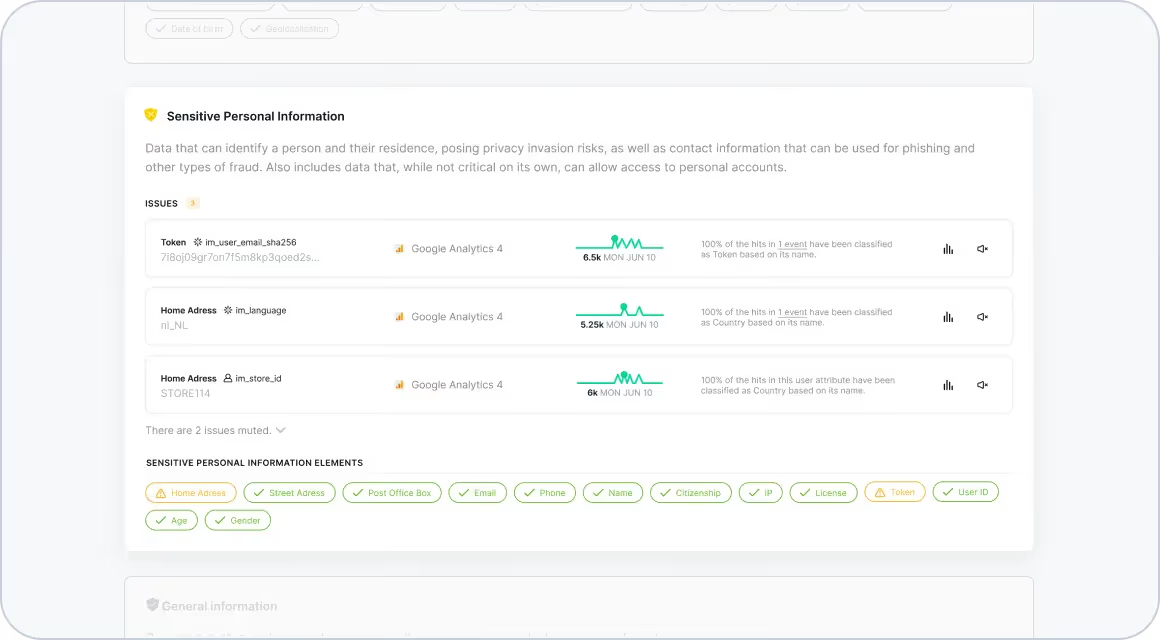
Ensure the privacy of your customers to avoid legal violations with the latest improvements in Trackingplan’s Privacy Report!
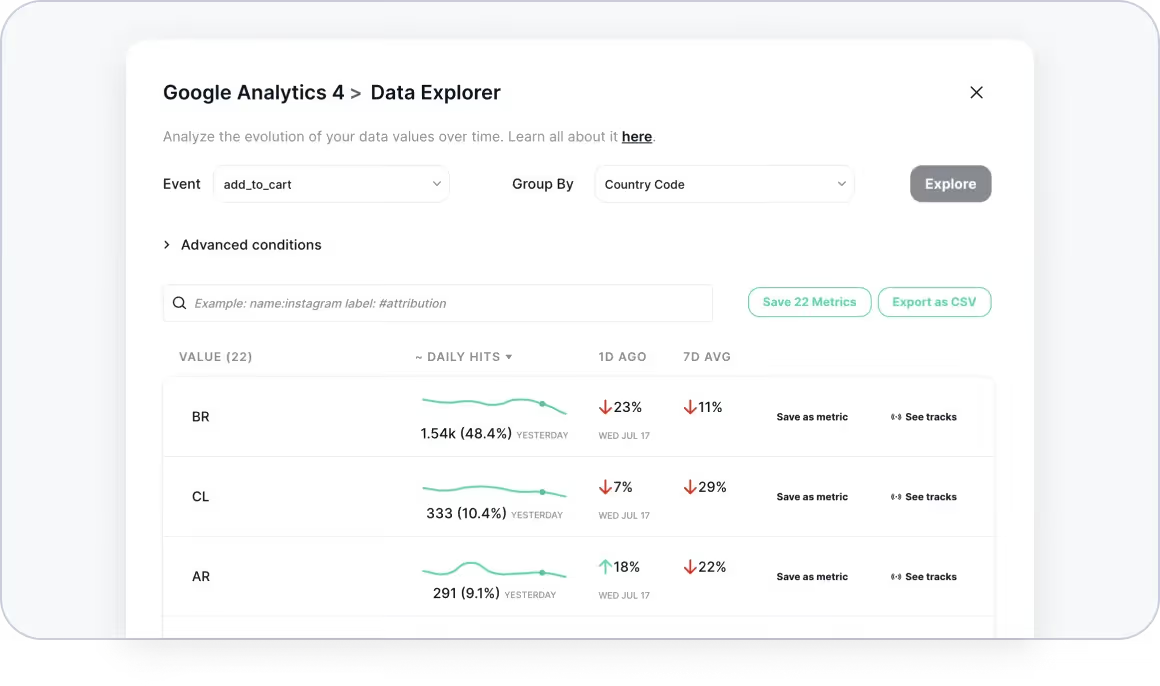
Filter traffic by country, track users who aren't logged in, or apply any wild condition you can imagine! With Trackingplan’s Events Data Explorer, you can now view event traffic with advanced filtering options to gain deeper insights and answer specific questions with ease.
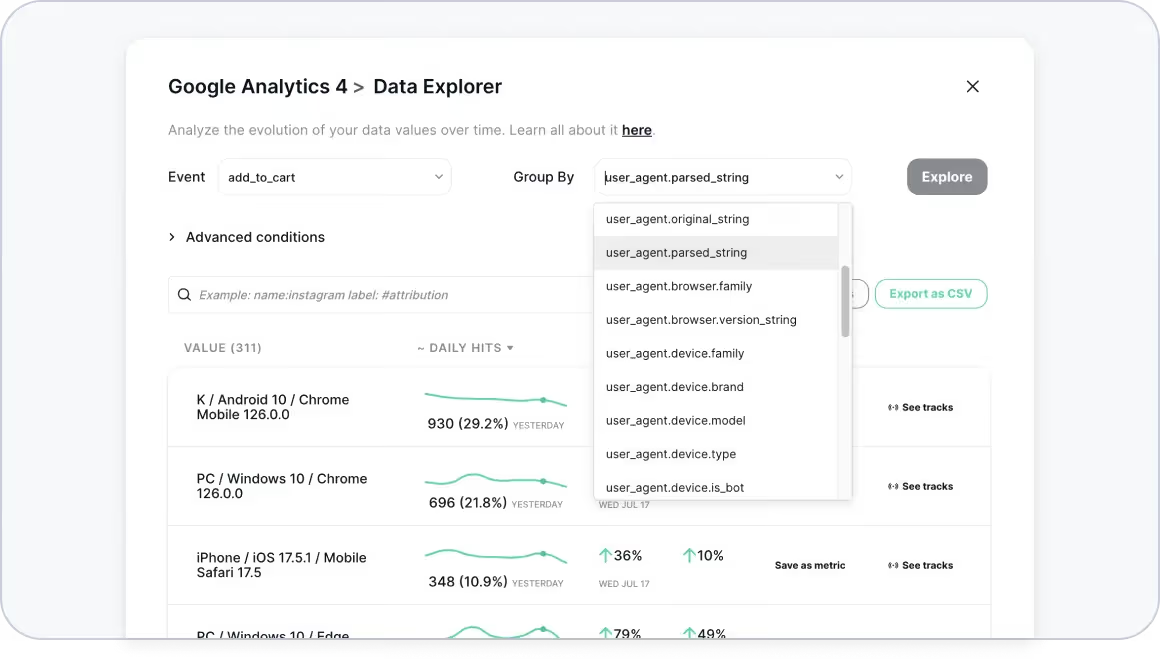
We’ve added User Agent Attributions to help you easily identify if certain warnings affect only certain groups of visitors based on their devices and browsers.
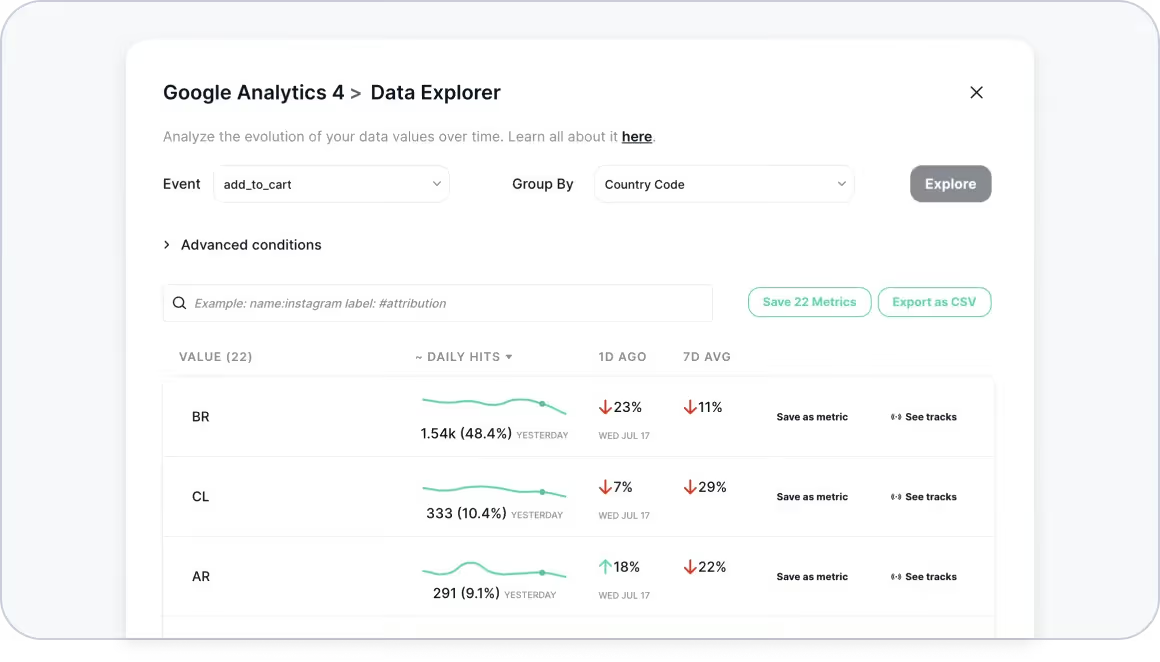
We’ve added Country Attributions to help you easily identify if certain warnings or issues are affecting specific groups of visitors based on their location.
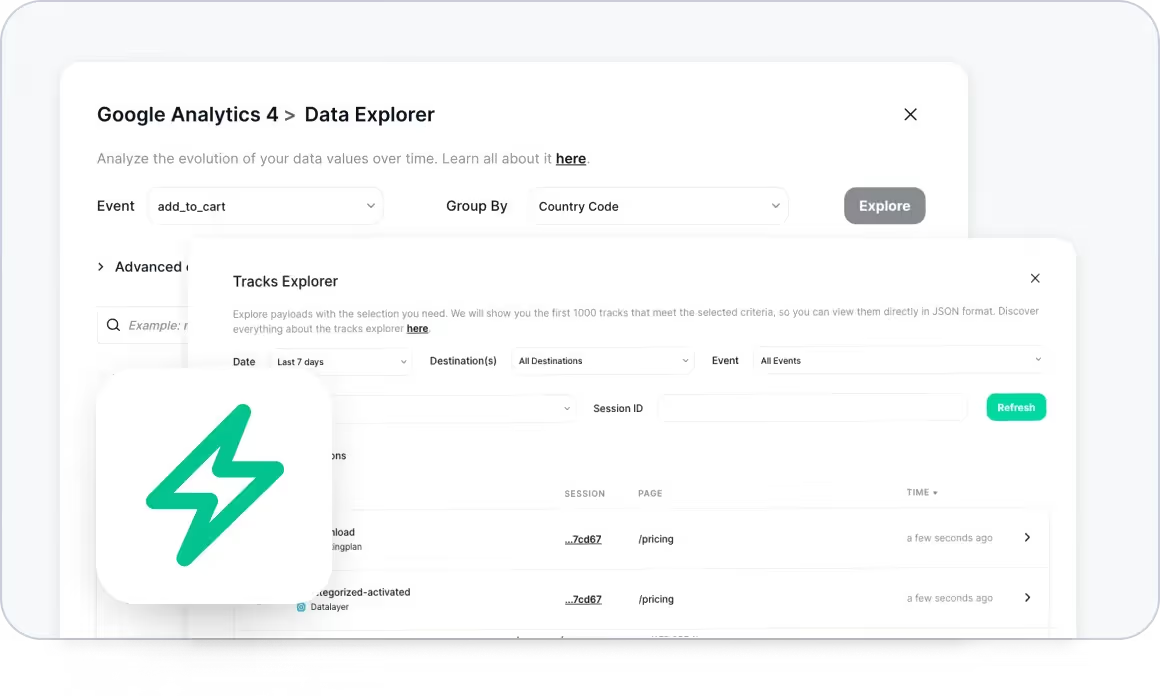
On our continuous effort to enhance performance, we've reduced query latencies to make Data Explorer and Tracks Explorer twice as fast.
Your place to ensure all your pixels and trackers are functioning correctly just got better!
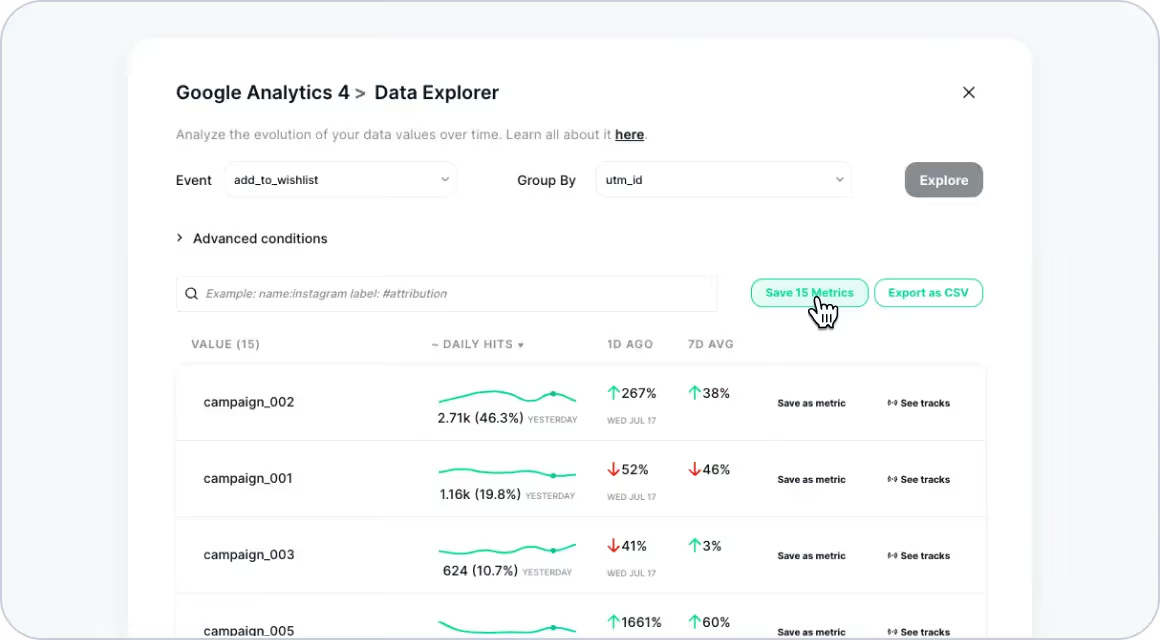
Now you can create multiple metrics at once and save them all with a single click.
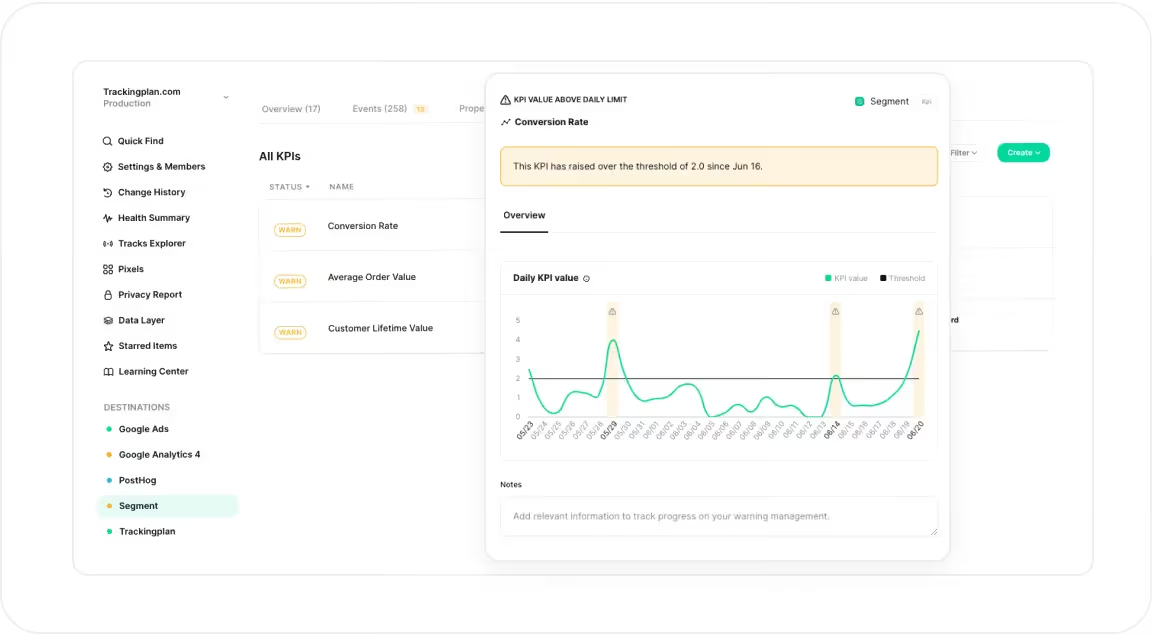
Ready to monitor the most relevant KPIs for your business and ensure your reports are accurate at a glance?
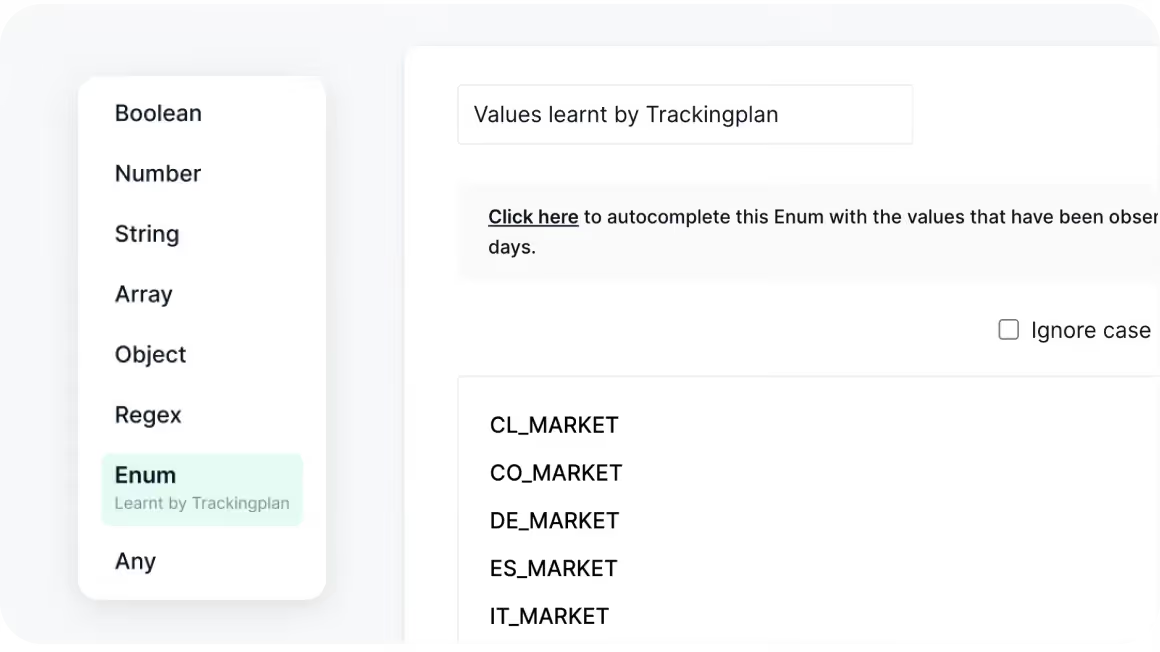
Now Trackinglan is capable of learning Enums based on your data!
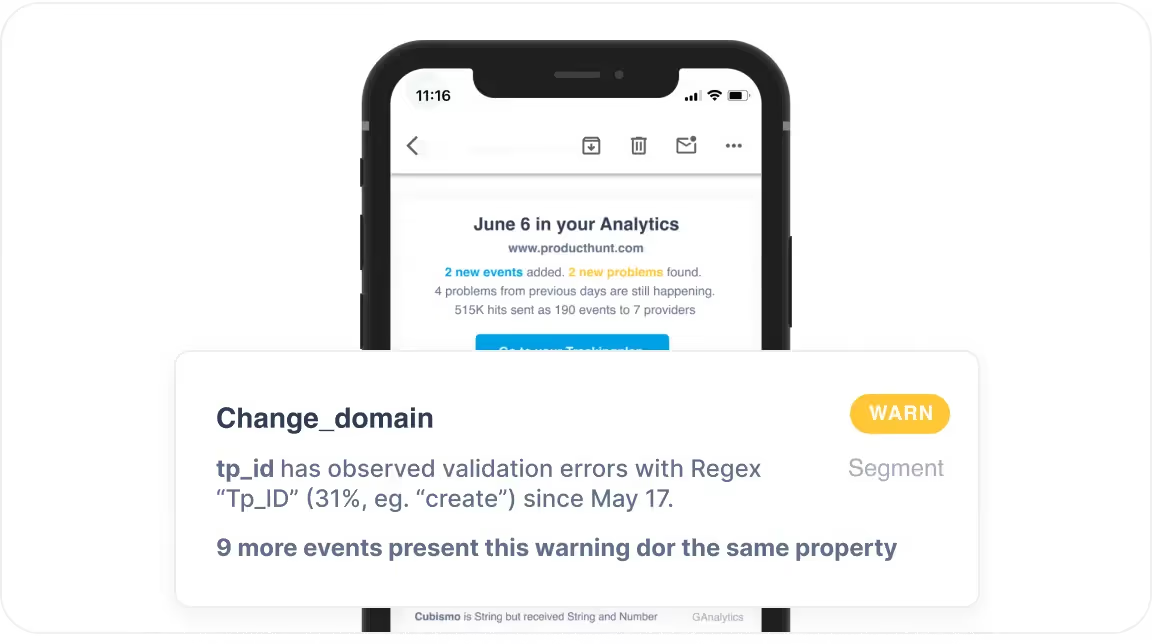
Now, if Trackingplan detects multiple events indicating the same warning for the same property, it will intelligently merge them in your Digest.
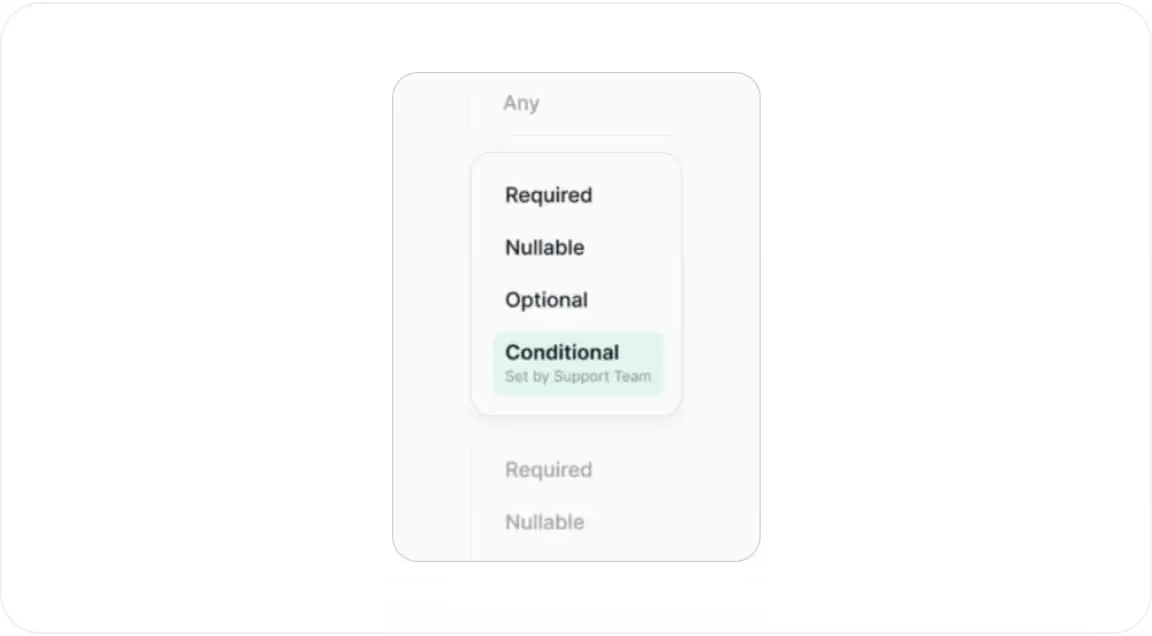
We are thrilled to announce the latest updates to Trackingplan's Monitoring Status feature, designed to give you even more clarity, control, and collaboration capabilities over your tracking setup.
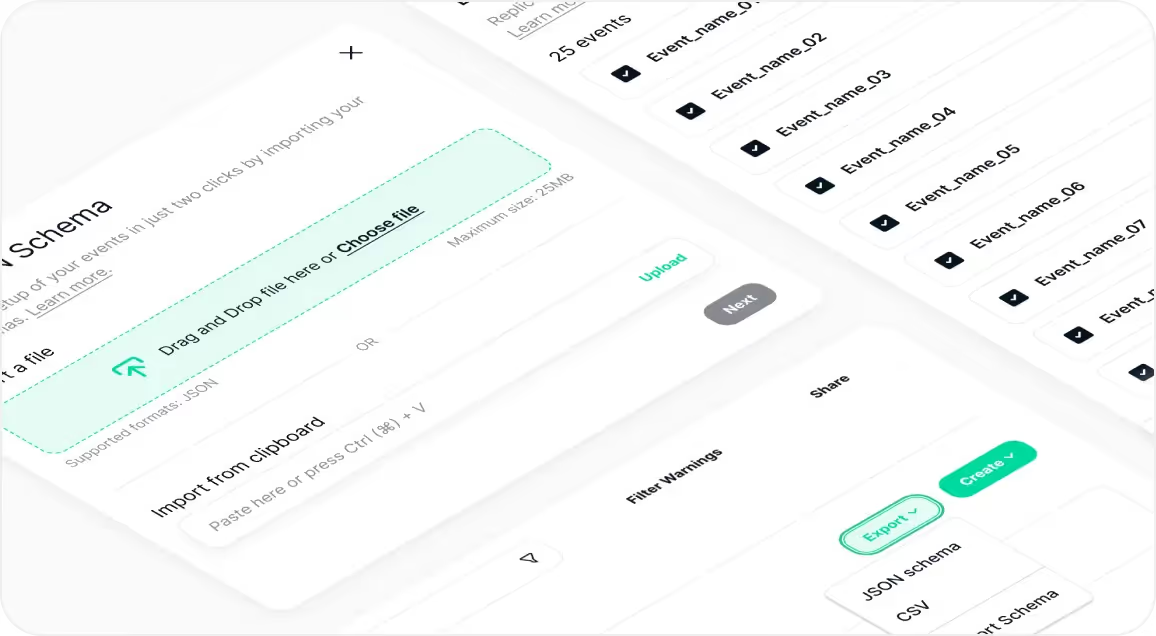
Now, with Trackingplan, you can copy your events’ specifications to other plans by exporting and importing them as a JSON Schema.
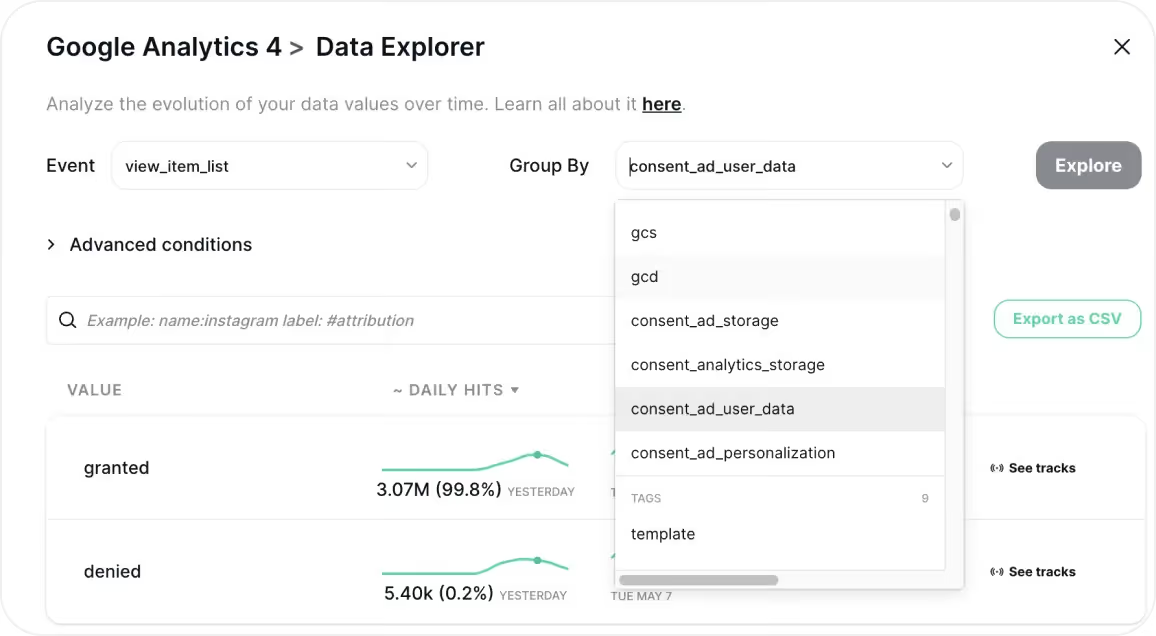
Now Trackingplan seamlessly integrates Google's Consent Mode parameters as attributions to ensure you’re not sending tracks to events whose consent for storing information has been denied.
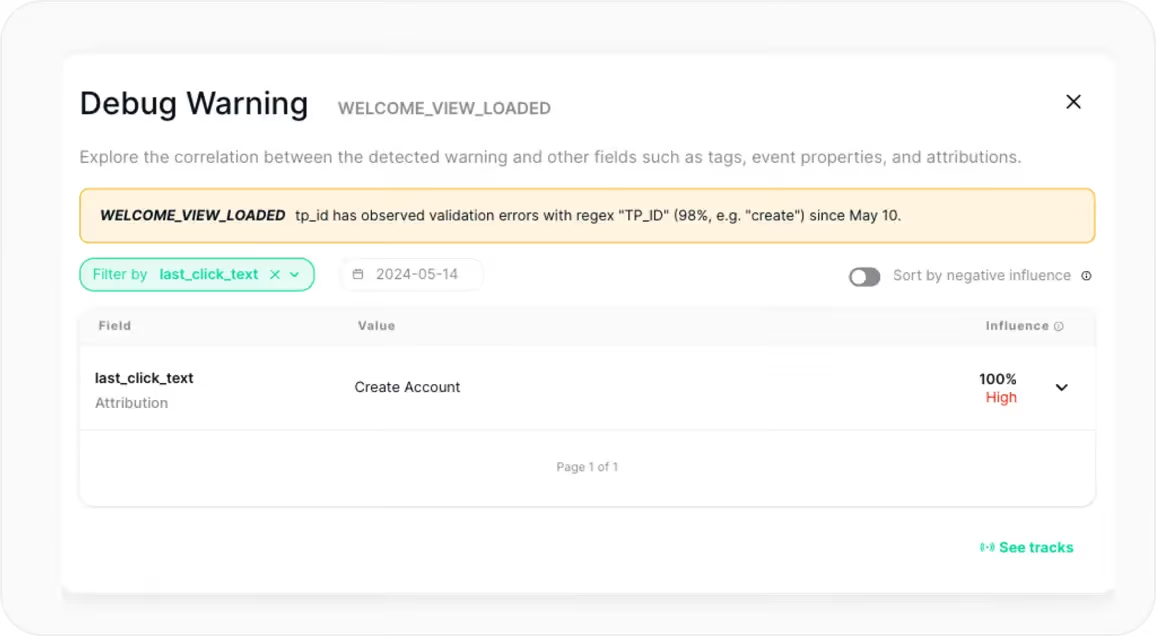
Now you can analyze what was clicked when your events are triggered with our new support for last-click attributions.
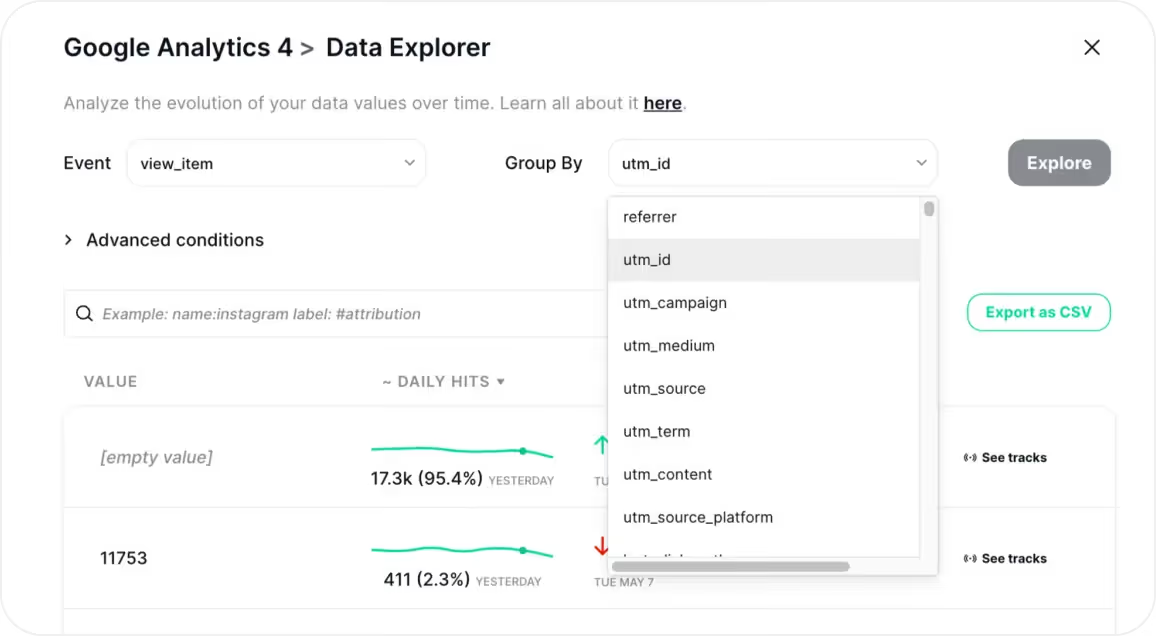
Now we support more attributions for your UTMs, enriching the information available when navigating your data across Trackingplan's Data Explorer, Tracks Explorer, and Debug Warnings.
.avif)
Debug and set rules for your Data Layer pushes directly in your Trackingplan’s Dashboard menu.

We’ve simplified the search bar at the top of your dashboard, allowing you to narrow down your searches with specific filters at each of your tabs.
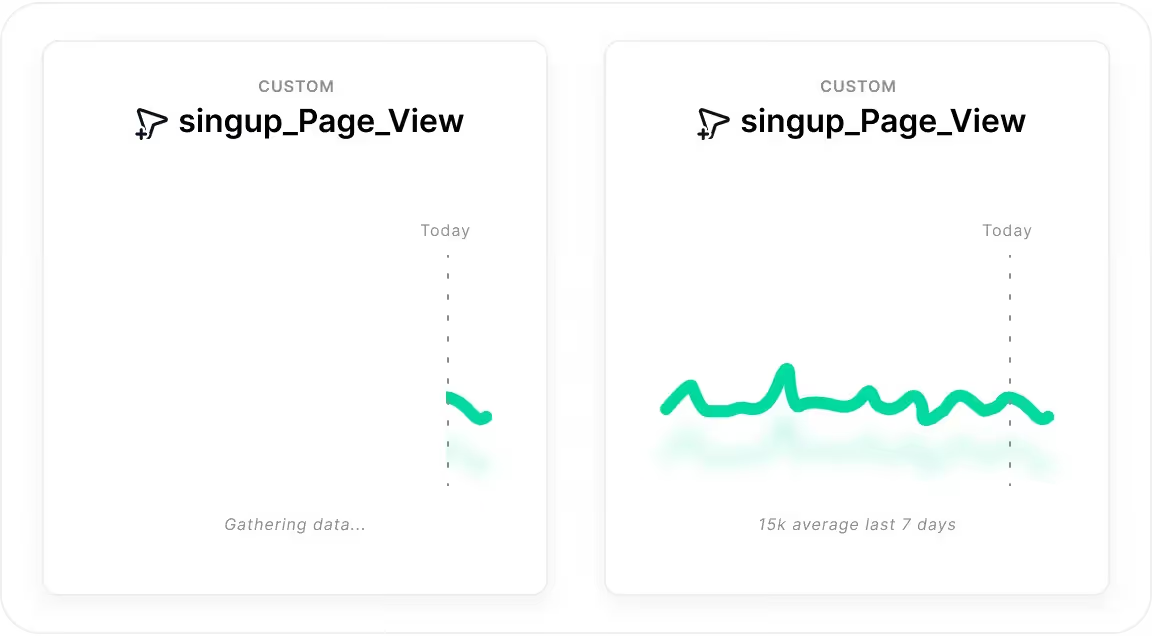
Say goodbye to waiting days to start playing with your custom events and metrics– with Trackingplan's Custom Events Backfilling, you can hit the ground running instantly.
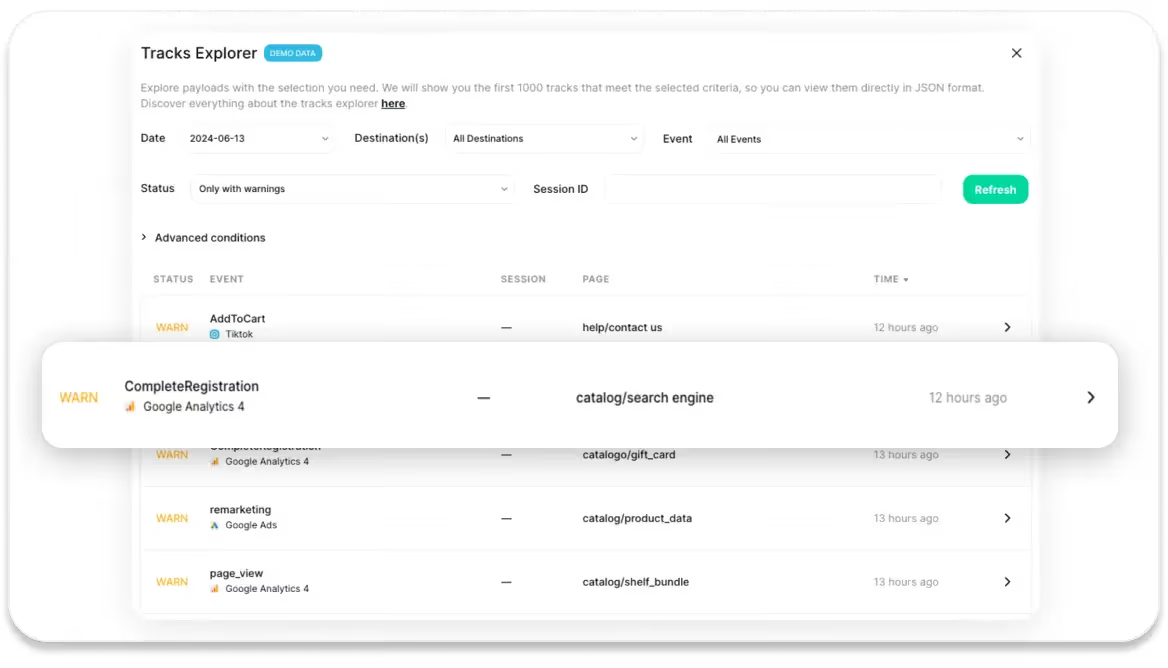
Be provided with a comprehensive view of all your tracks in raw, parsed, and data layer format without the need to download them, allowing you to see in real time what has been sent to your servers and analytics providers.
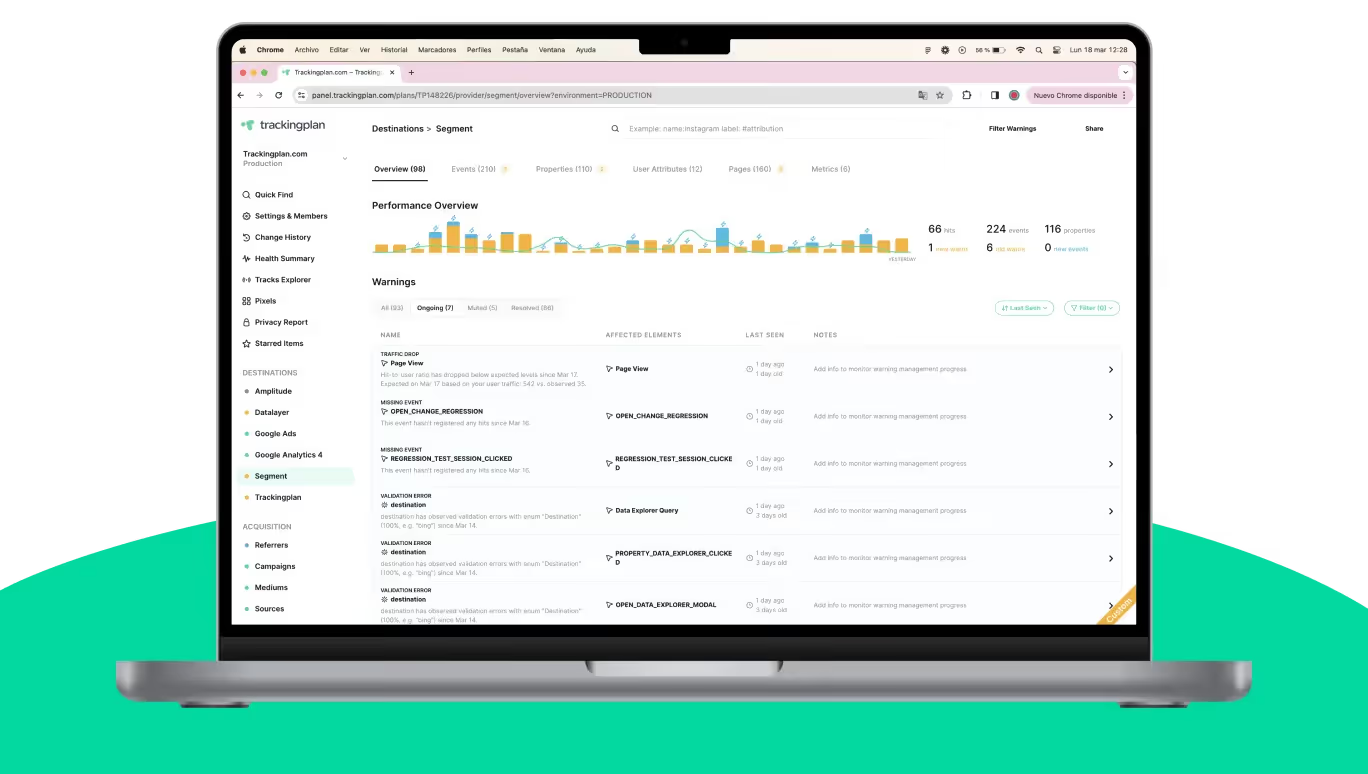
Say goodbye to scattered alerts and say hello to your one-stop shop to see all your warnings for each of your providers.
.avif)
Now Trackingplan automatically validates the values and limits within Google Analytics to inform you about any implementation error in record time.
.avif)
Now Trackingplan makes it easier to help you better understand the logic behind your property specifications.
.avif)
A new way to manage your warnings is here. Welcome to your new Warning Management View! Your one-stop-shop to deep dive into your warnings, understand them better, and collaborate with your team to get them fixed in record time.
.avif)
We're thrilled to announce that we've redesigned Trackingplan's dashboard to offer a more seamless and harmonious experience.
.avif)
At Trackingplan we know there are certain events whose increase can be deemed as negative. That's why we now alert you about anomalous traffic peaks.
.avif)
Now, you can also filter by offline events, making it easier to sort and discover them within your searches.
.avif)
Export your Pixels Summary as CSV to gain deeper insights about the status of your Pixels.
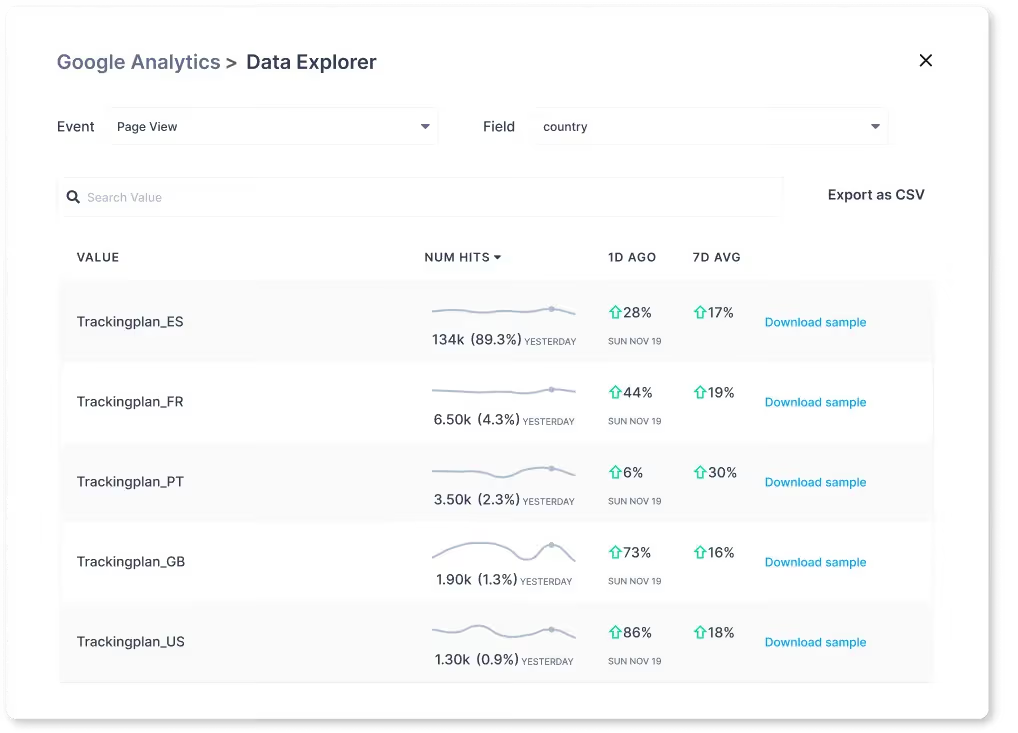
Now tags also allow you to break down event traffic by country, or any other values that you have previously tagged (release version, build number, app version, test name, etc.).


